In this article, you’ll learn how to navigate the Reports section in Thrive Apprentice—including the Apprentice Snapshot, Course Dashboard with its detailed sub-reports, Quiz Reports, filtering options, and exporting data.
Accessing the Reports Section
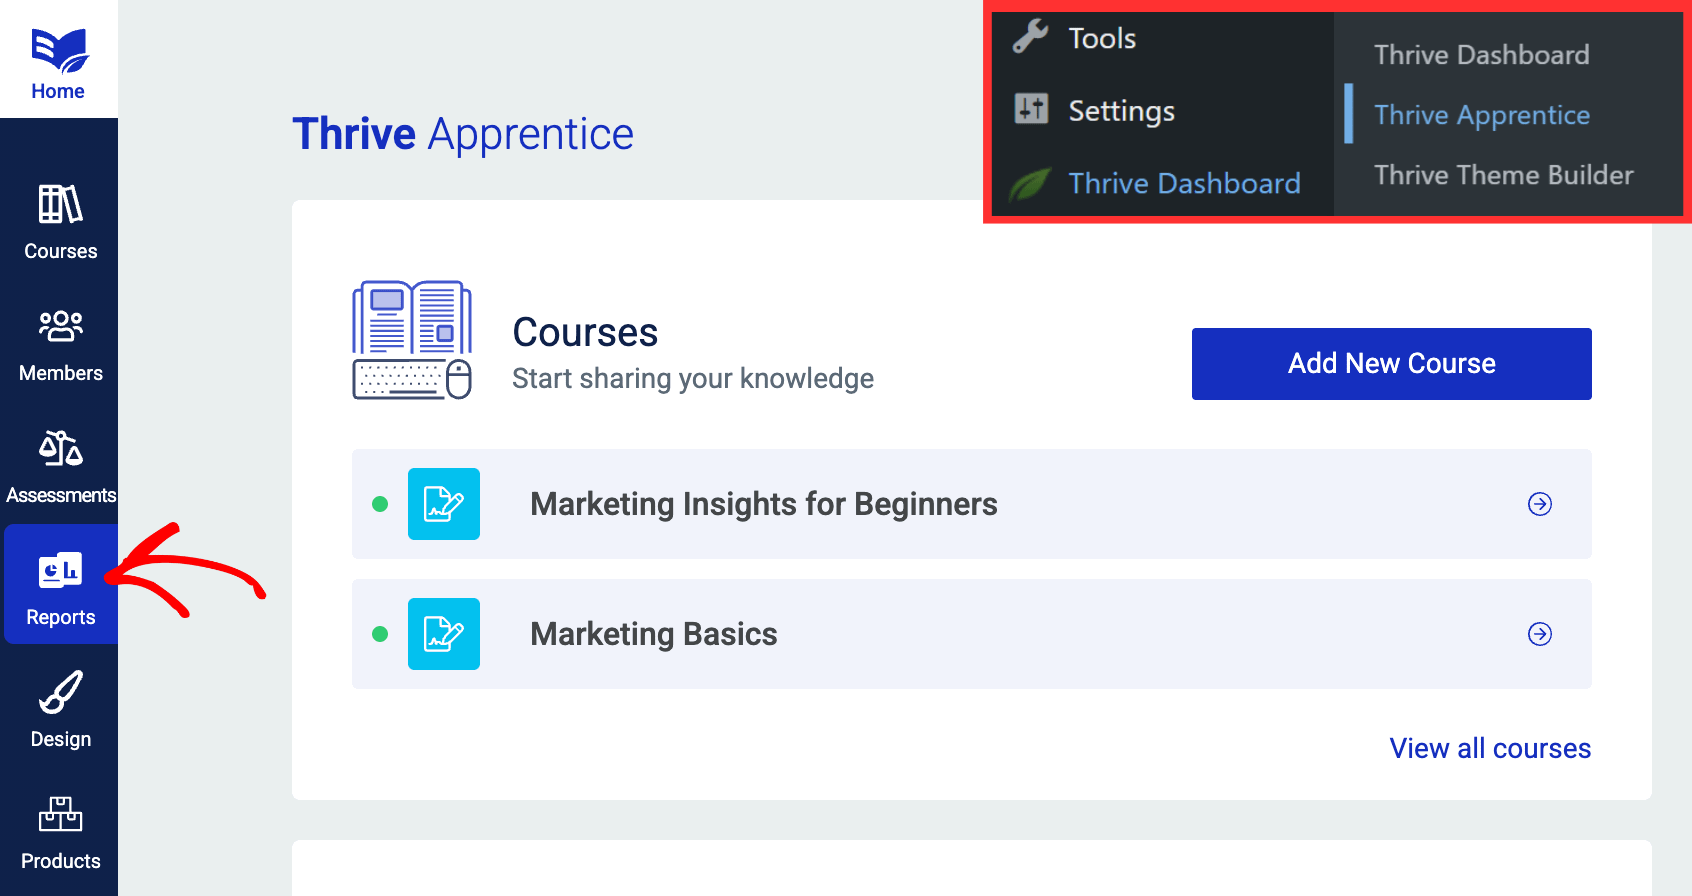
- In your WordPress dashboard, navigate to Thrive Dashboard > Thrive Apprentice.
- Click Reports in the left sidebar.
If this is your first time accessing the Reports section, you’ll see a popup asking you to migrate your existing data. This one-time migration reorganizes the data in your Thrive Apprentice database so it can be used for generating reports. Click Migrate to proceed.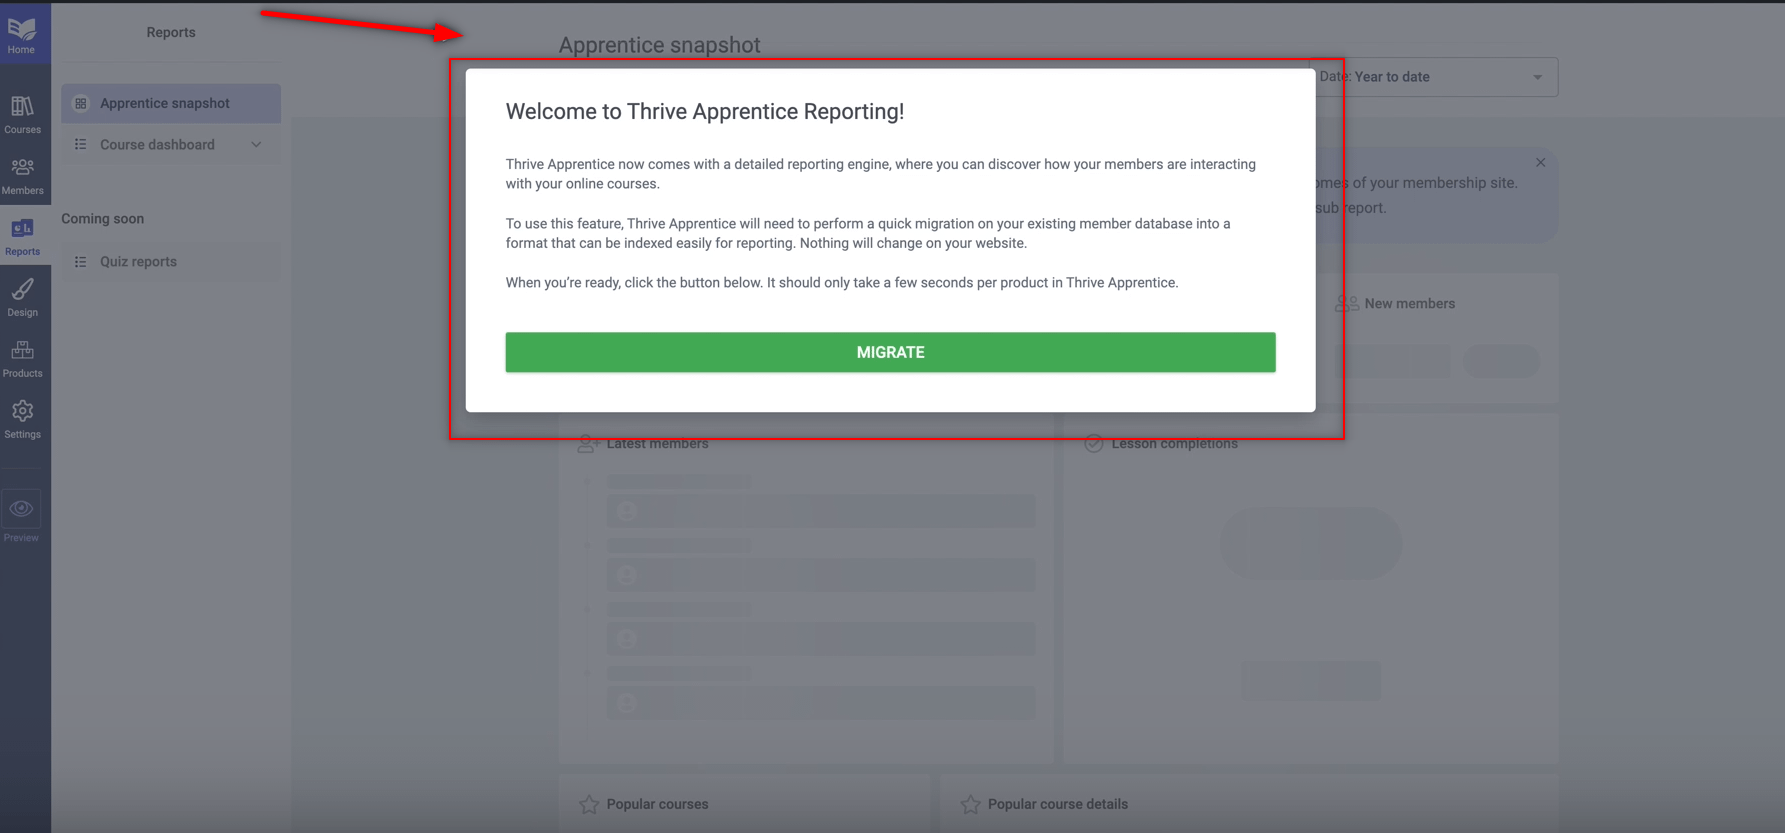
Navigating the Reports Section
The Reports page has a left-column navigation panel that lets you switch between three main areas:
- Apprentice Snapshot — A high-level overview of your online school’s performance.
- Course Dashboard — Detailed reports broken down by specific metrics (enrollments, completions, progress, etc.).
- Quiz Reports — Reports related to quiz performance across your courses.
Apprentice Snapshot
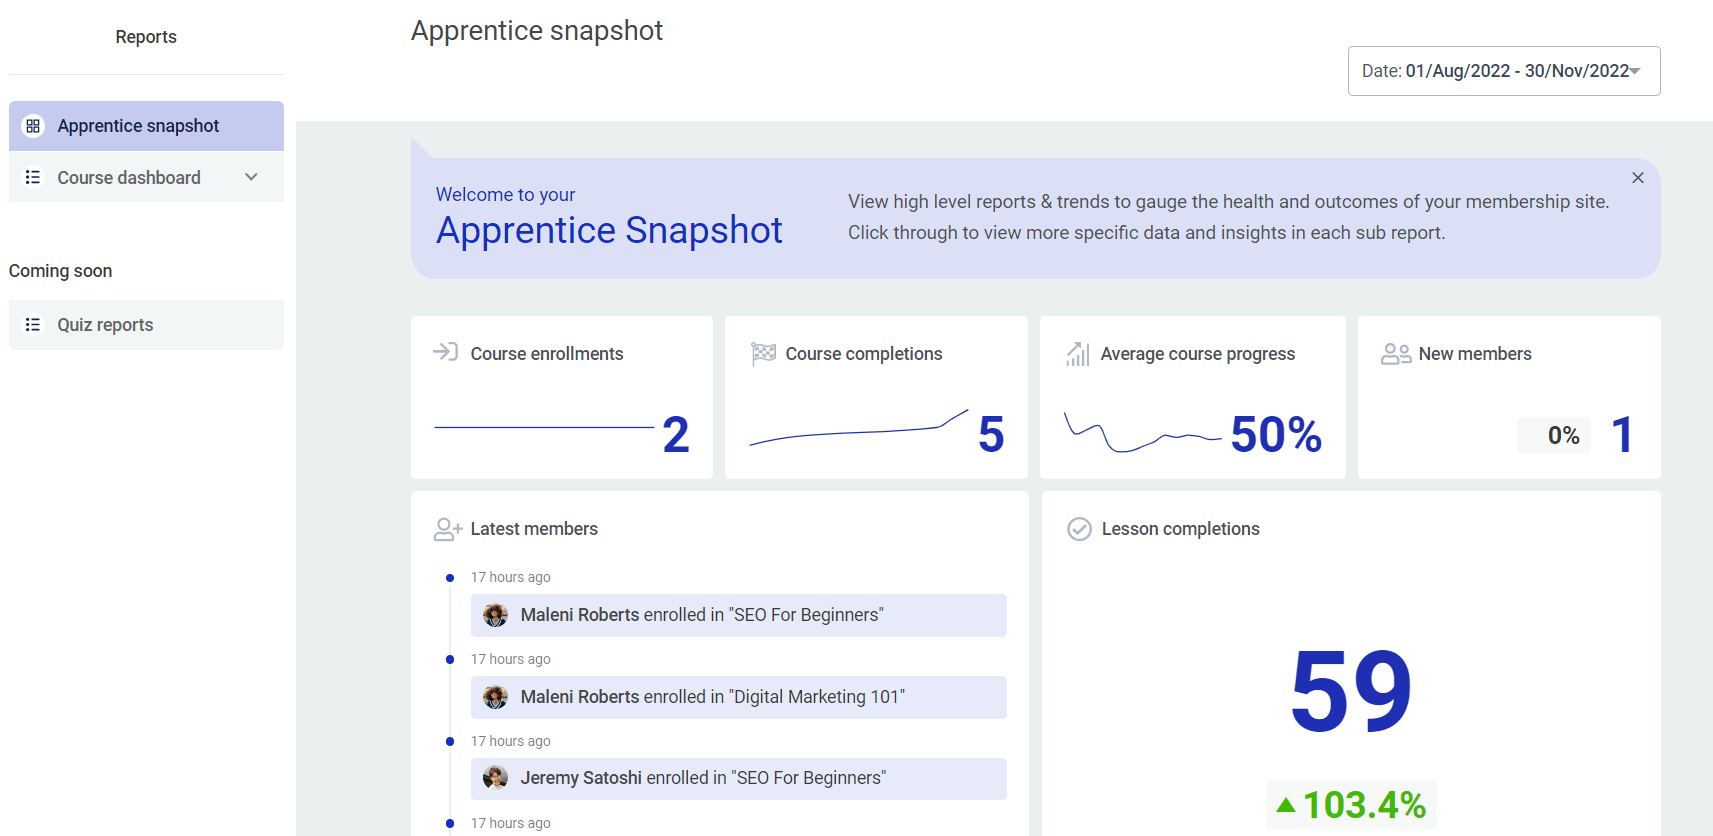
The Apprentice Snapshot gives you a quick overview of what’s happening across your entire online school. Click Apprentice Snapshot in the left column to open it.
Here you’ll find overview graphs showing course enrollments, course progress, and course completions. Hover over the various parts of the graphs to see detailed information about each metric.
Course Dashboard
The Course Dashboard is the most detailed area of the Reports section. Click Course Dashboard in the left column to expand it and see all available sub-reports.
You can also click on the stat cards displayed on the Course Dashboard page to jump directly to a specific report.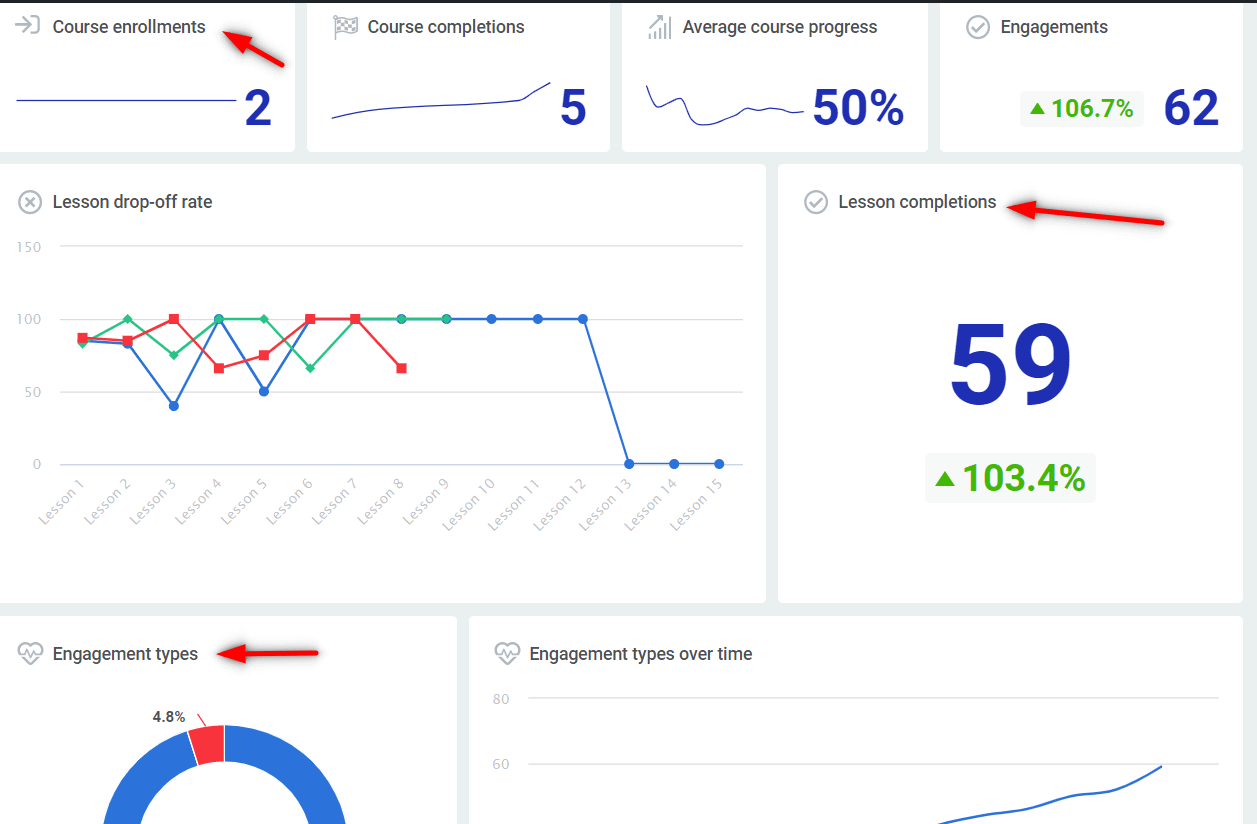
The Course Dashboard includes the following sub-reports:
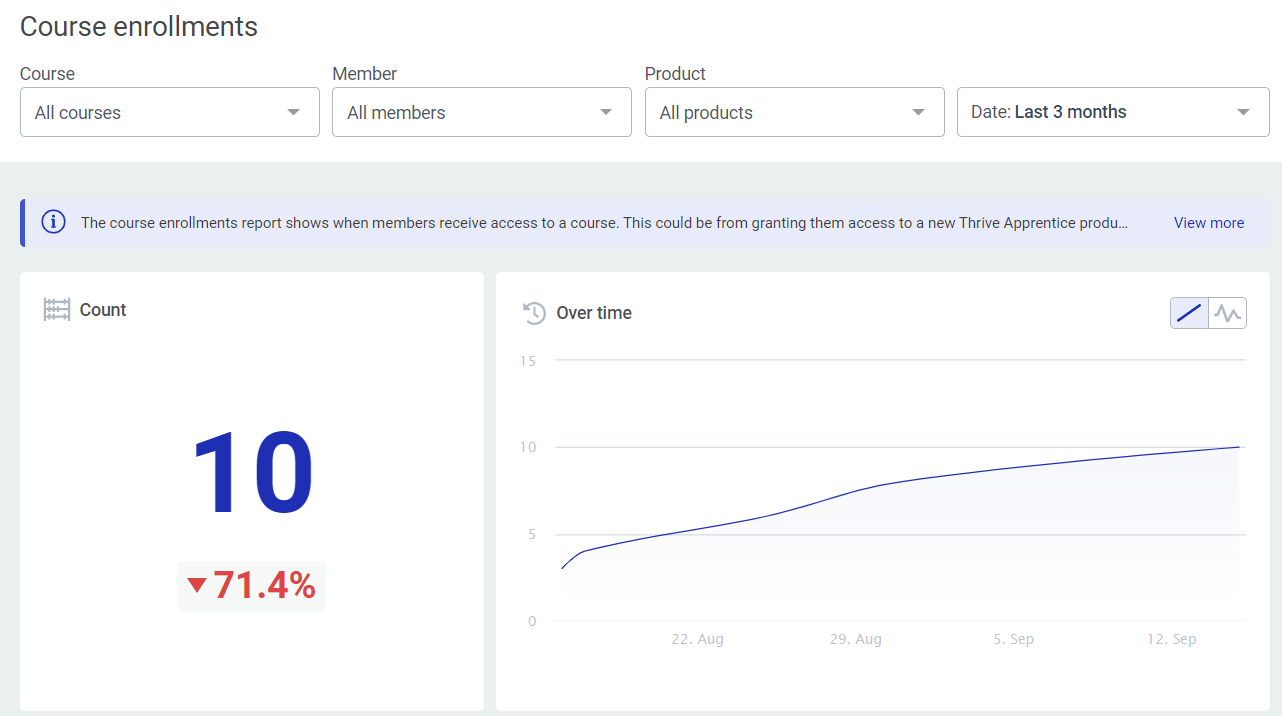
Course Enrollments
Shows when members receive access to a course—whether from being granted access to a new Product or from having a course added to a Product they already have access to. The graph displays enrollment trends over time, and the details table below shows individual students, their courses, associated Products, enrollment source, date, and status.
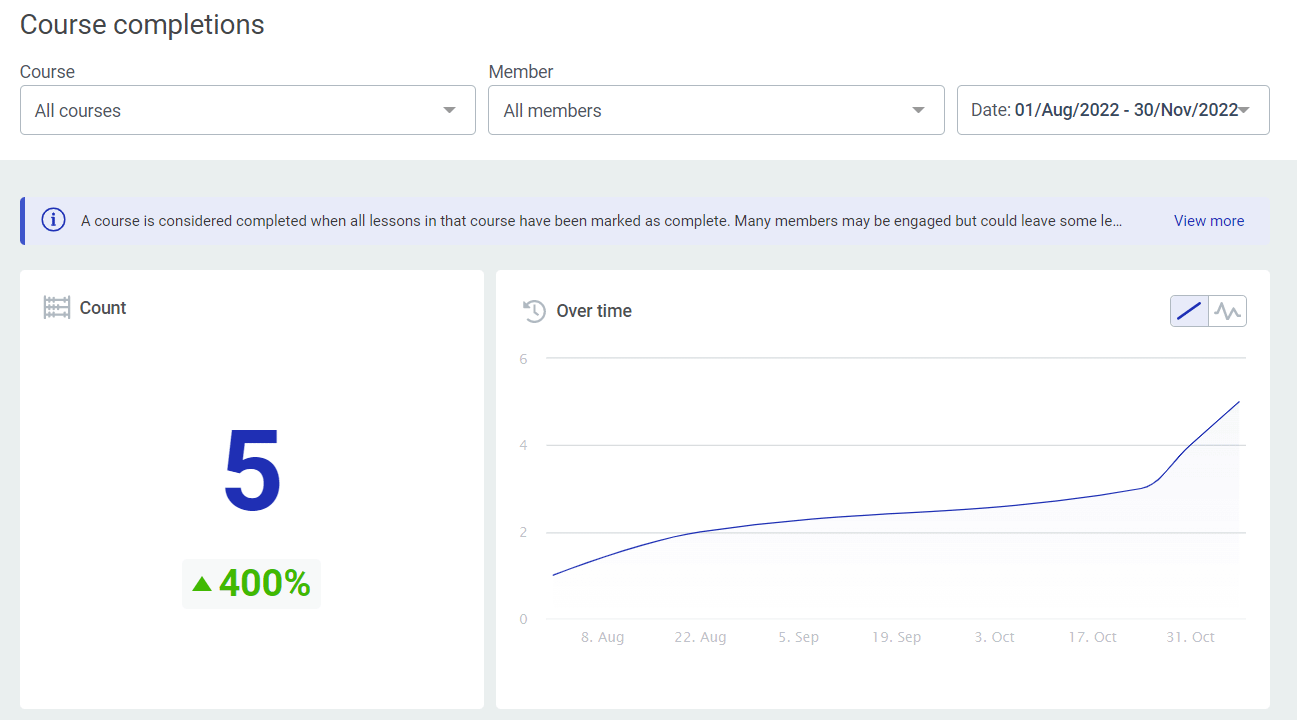
Course Completions
Displays stats for course completion across your school. A course is considered complete when all lessons in that course are marked as complete. Note that some students may engage with course content without finishing all lessons.
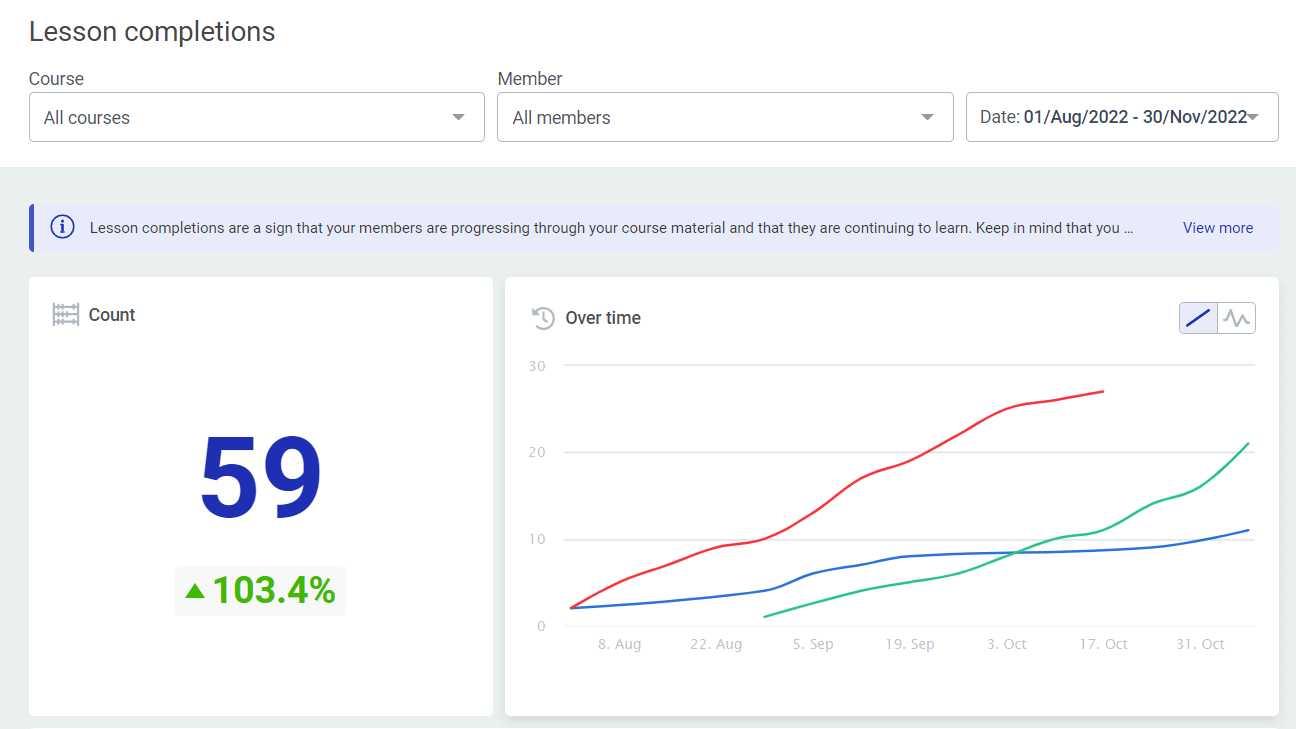
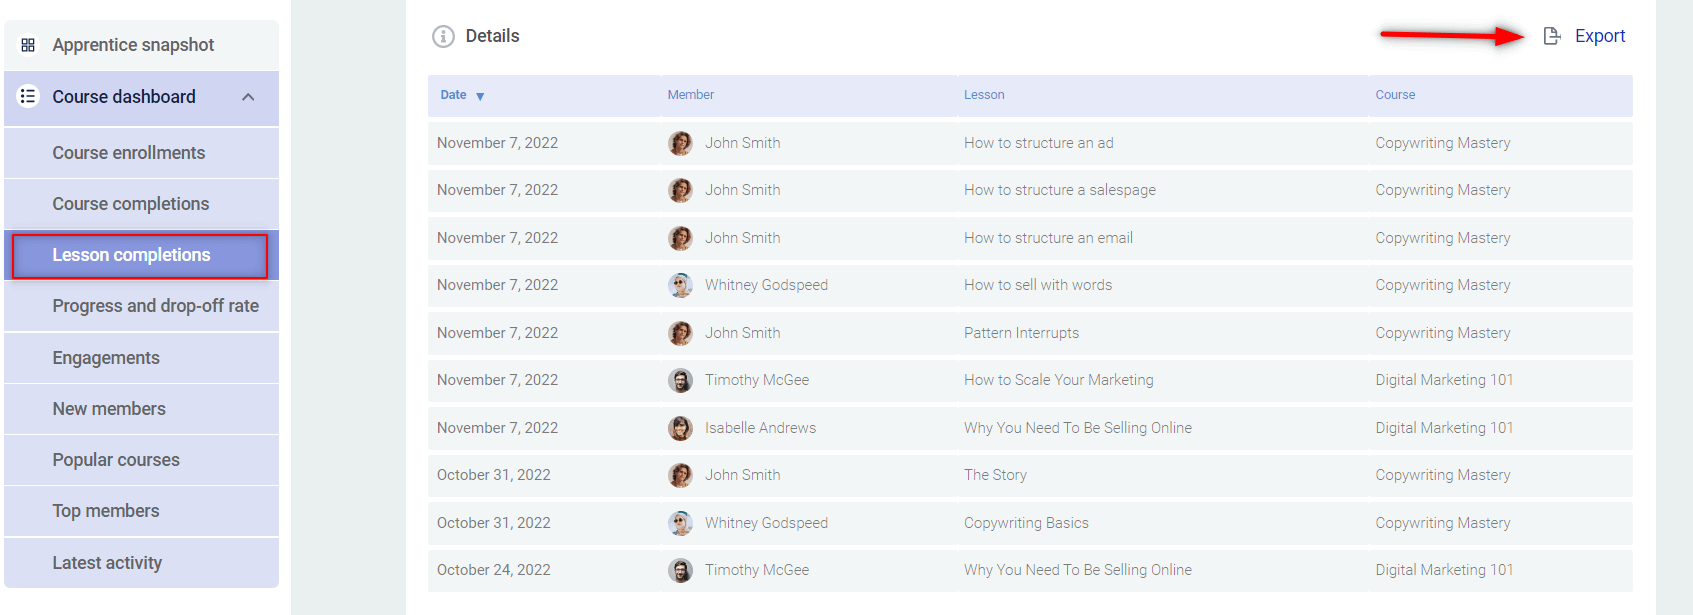
Lesson Completions
Shows how students are progressing through your course material on a lesson-by-lesson basis. Keep in mind that longer courses will naturally have more lesson completions.
Progress and Drop-Off Rate
Helps you identify which lessons cause members to lose interest. The charts show the percentage of course content students have completed over the selected date range and how that percentage changes over time.
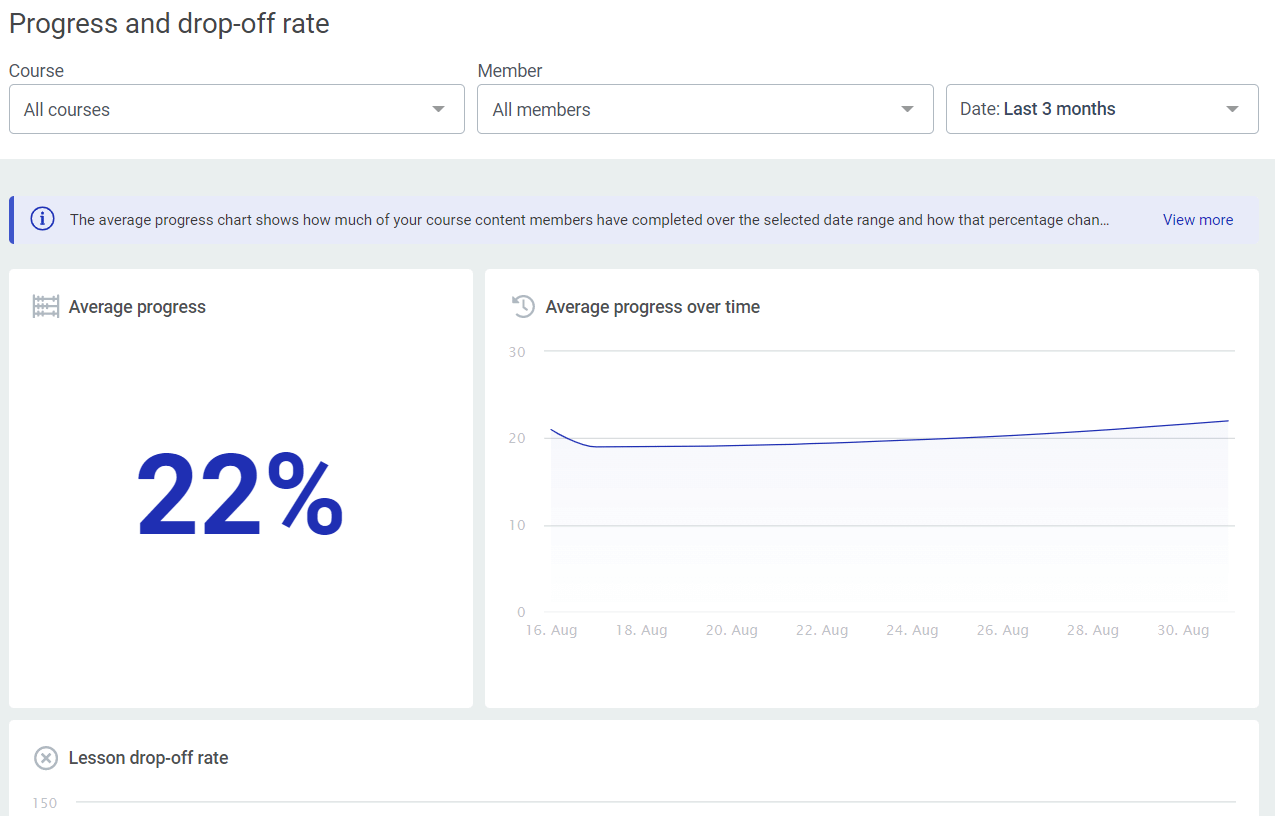
The drop-off rate chart shows completion rates for each sequential lesson in a course. You can click on a course name to toggle its data on or off, allowing you to focus on one course at a time. At the bottom, you’ll see lessons listed in sequential order—hover over each to see its completion rate.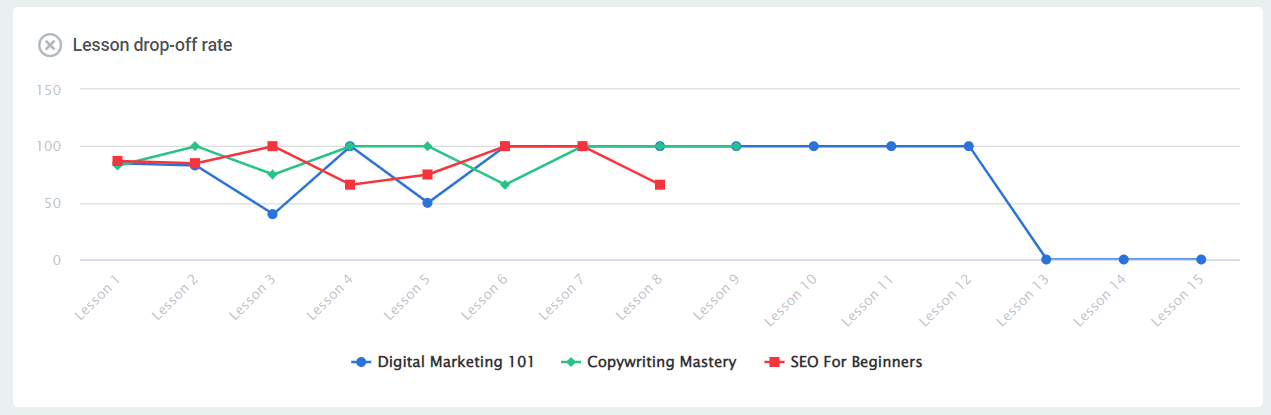
Note: These reports only include data for members active during the selected time period. Choose “All time” to see total completion rates, or select a specific date range to see how active students increased their progress. When new students enroll, the average progress will temporarily drop because their 0% progress is included in the average.
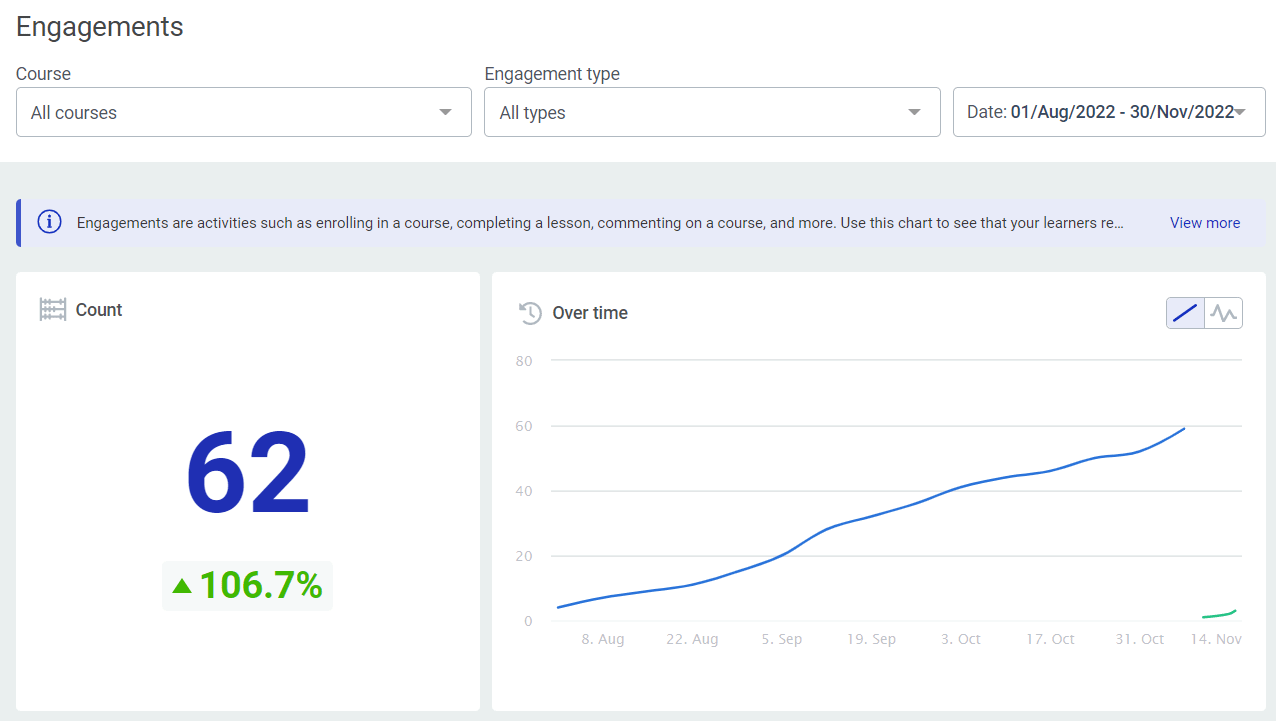
Engagements
Shows whether your learners remain engaged and active. Engagements include activities such as enrolling in a course, completing a lesson, commenting on a course, and similar interactions.
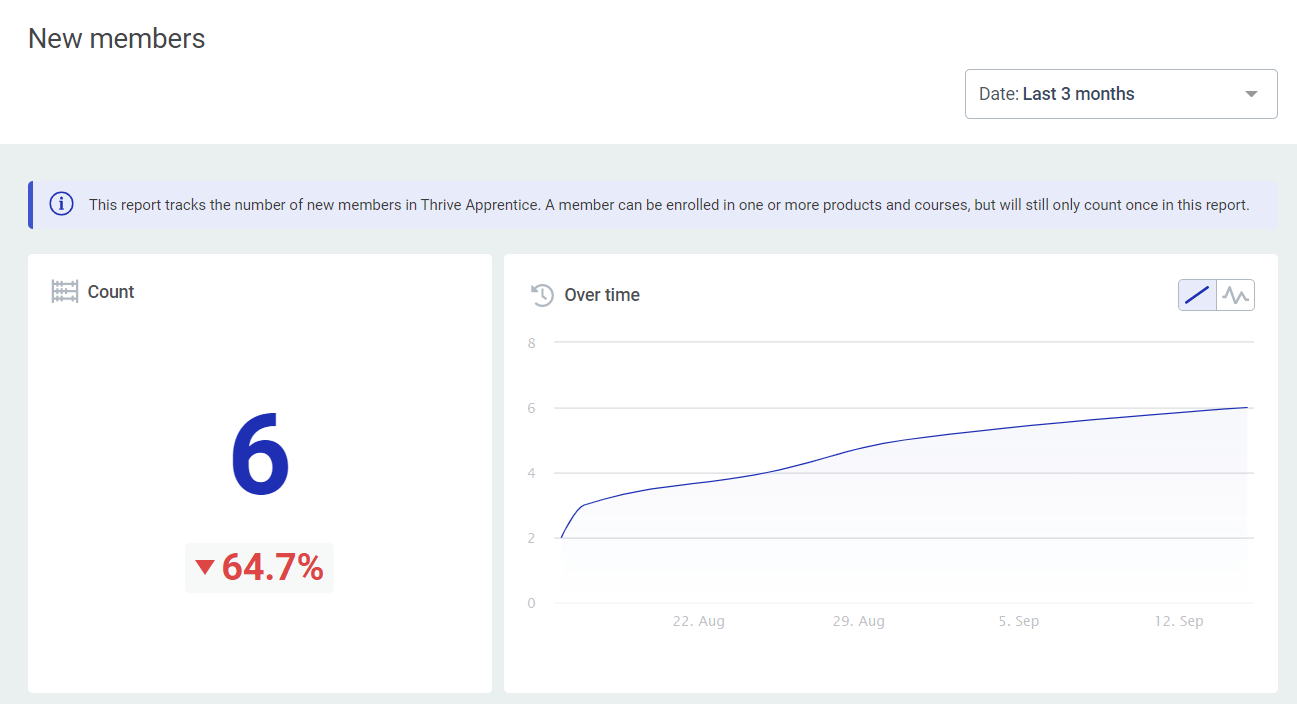
New Members
Tracks the number of new members in Thrive Apprentice, showing enrollment dates and how numbers have changed over time. A member who is enrolled in multiple Products and courses still counts only once in this report.
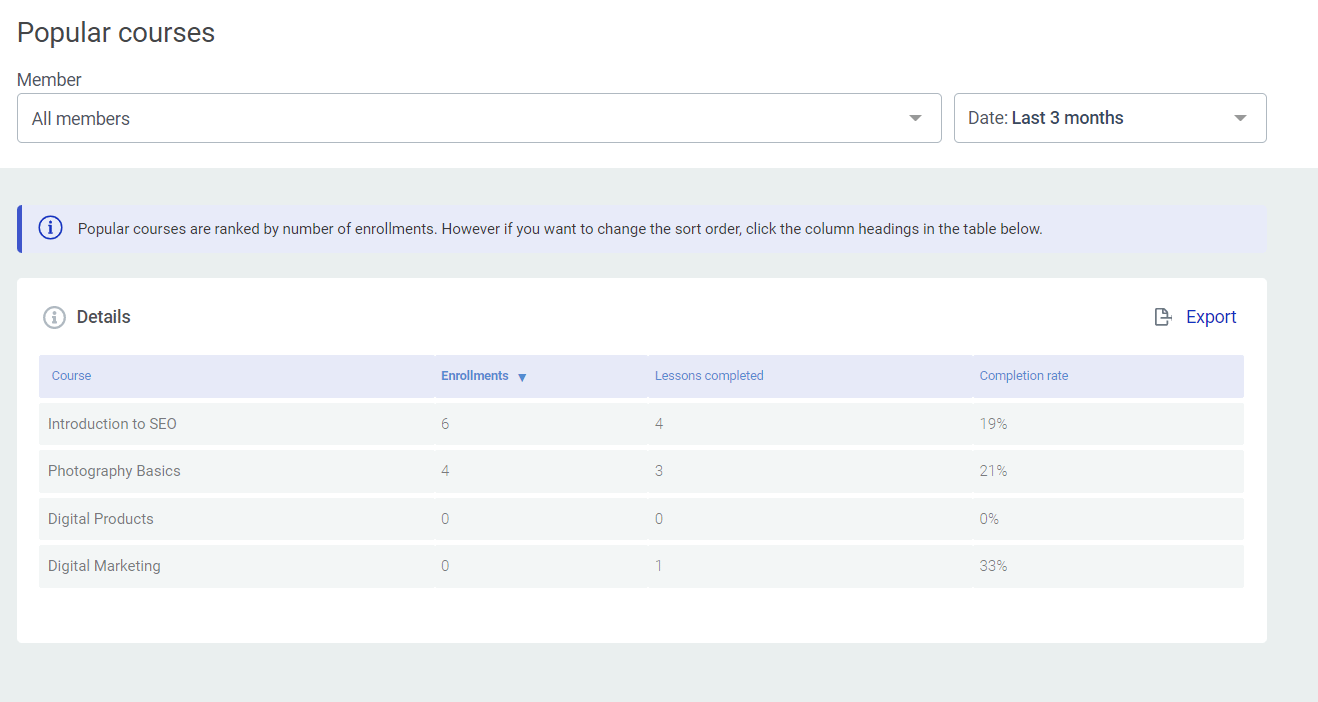
Popular Courses
Ranks your courses by number of enrollments. Click the column headings in the Details table to change the sort order.
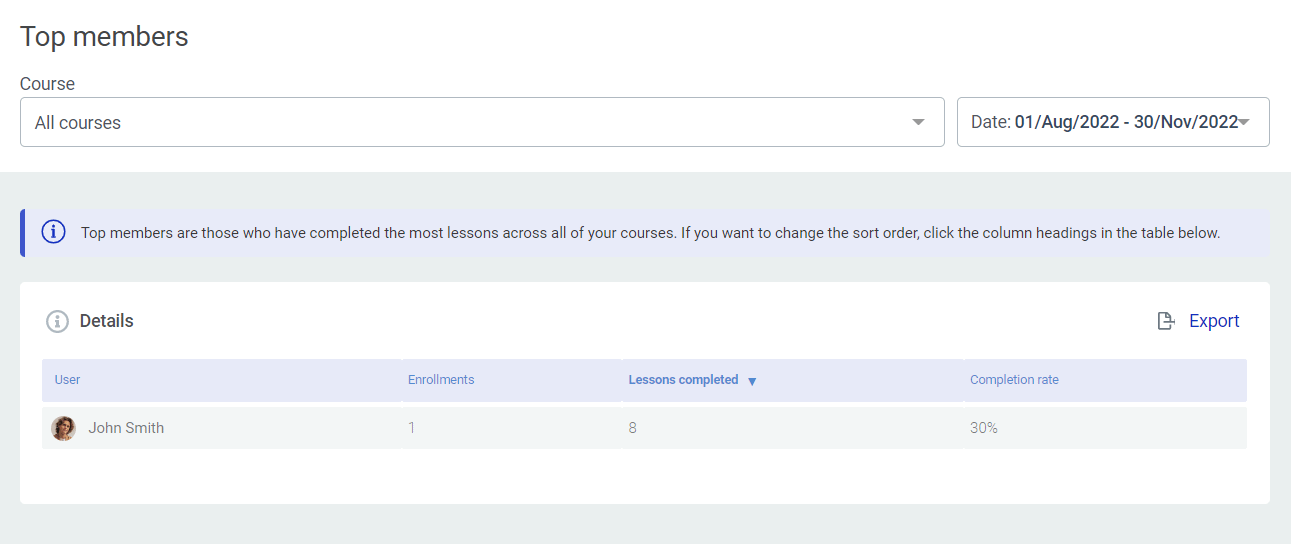
Top Members
Shows the students who have completed the most lessons across all available courses.
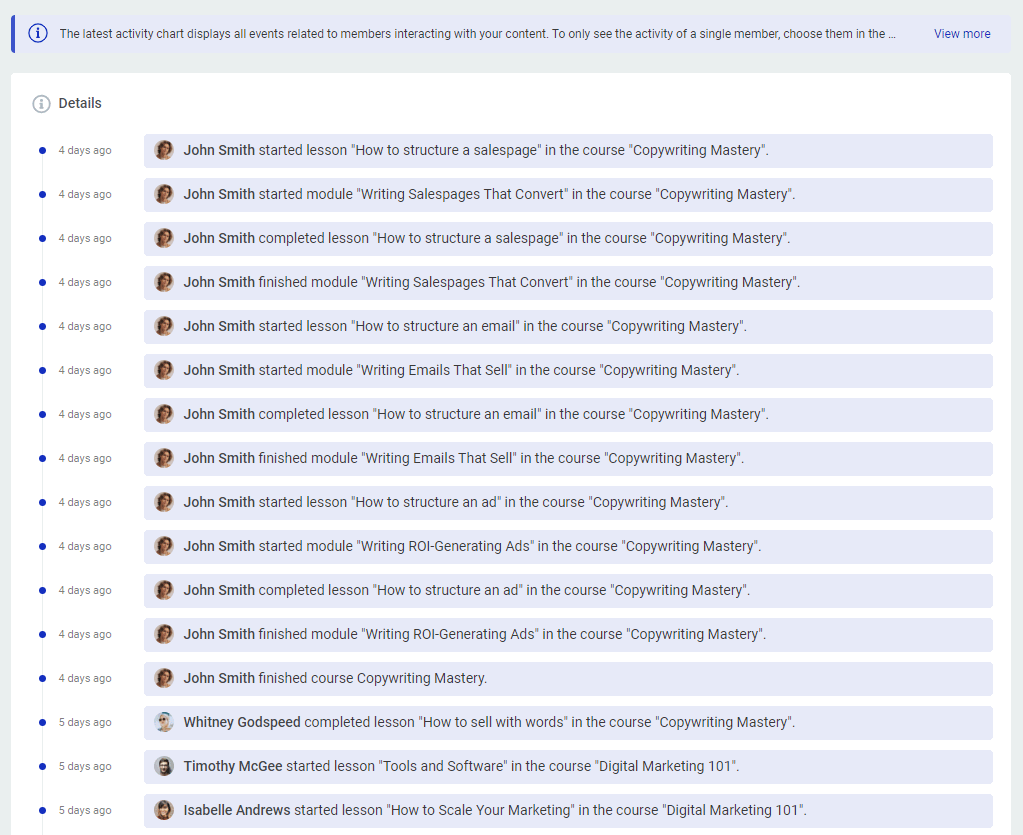
Latest Activity
Displays all recent events related to members interacting with your content in chronological order. To view the activity of a single member, select them from the Members filter at the top of the report.
Filtering Reports
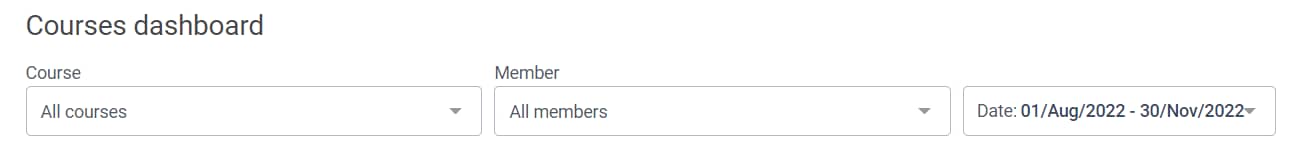
At the top of each dashboard and sub-report, you’ll find filtering options. You can filter data by:
- Course — View data for a specific course or all courses.
- Member — Filter to see activity for a specific student.
- Product — Filter by a specific Product.
- Time period — Select a predefined time range or choose “All time” to see all data.
These filters work the same way across all sections of the Reports navigation. Combining multiple filters gives you more precise results—for example, you can view all students enrolled in a specific course through a particular Product during the last 30 days.
Exporting Reports
- Navigate to the sub-report you want to export.
- Apply any filters to narrow down the data.
- Click the Export button.
- Choose whether to download the current view or all results.
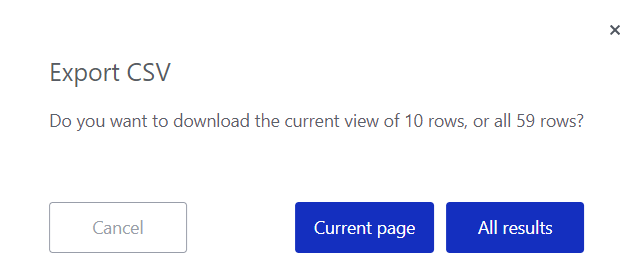
- The CSV file will be downloaded to your computer.
Tip: Exported CSV files can be opened in spreadsheet applications like Google Sheets or Microsoft Excel for further analysis.
That’s it! You now know how to navigate and use the Reports section in Thrive Apprentice to monitor your courses, track student progress, and make data-driven decisions about your content.
Related Resources
- Viewing Member Data: Learn how to view individual member data for detailed student-level insights.
- Sorting Students by Enrollment Date: Quickly sort and filter students by enrollment date in the Members section.
- Managing Members: Review how to manage members and their course access.
- Course Completion Behavior: Set up course completion behavior to improve your completion rates.