Data is essential for understanding your audience and improving your quiz conversion rates. In this article, you’ll learn about the four main reports available in Thrive Quiz Builder and how to interpret them.
Accessing Your Reports
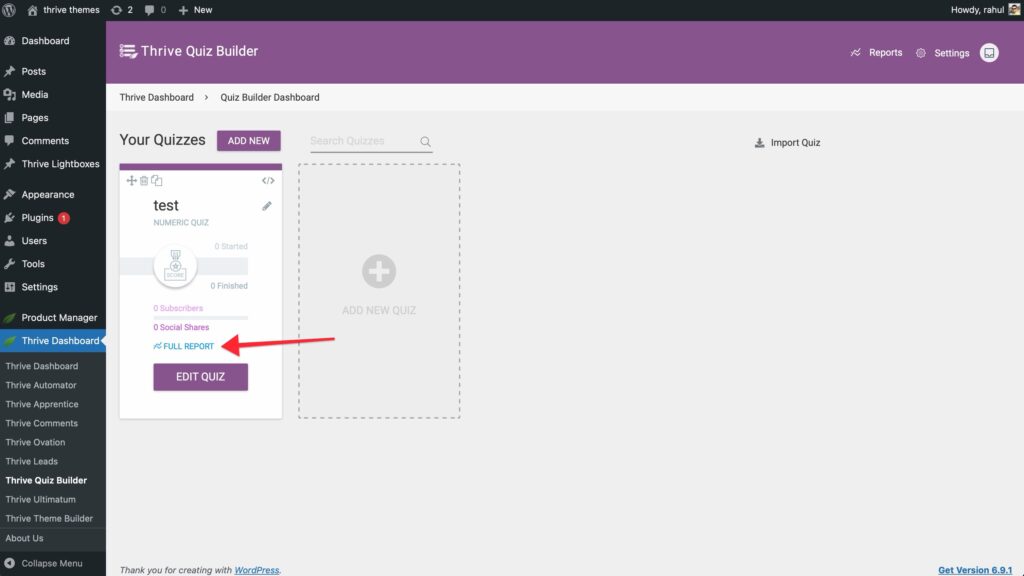
- Navigate to the Thrive Dashboard > Thrive Quiz Builder.
- Hover over the quiz you want to analyze and click the Full Report button.
- Alternatively, click the Reports tab at the top of the individual Quiz Dashboard.
The Four Core Reports
Thrive Quiz Builder provides four distinct ways to view your data:
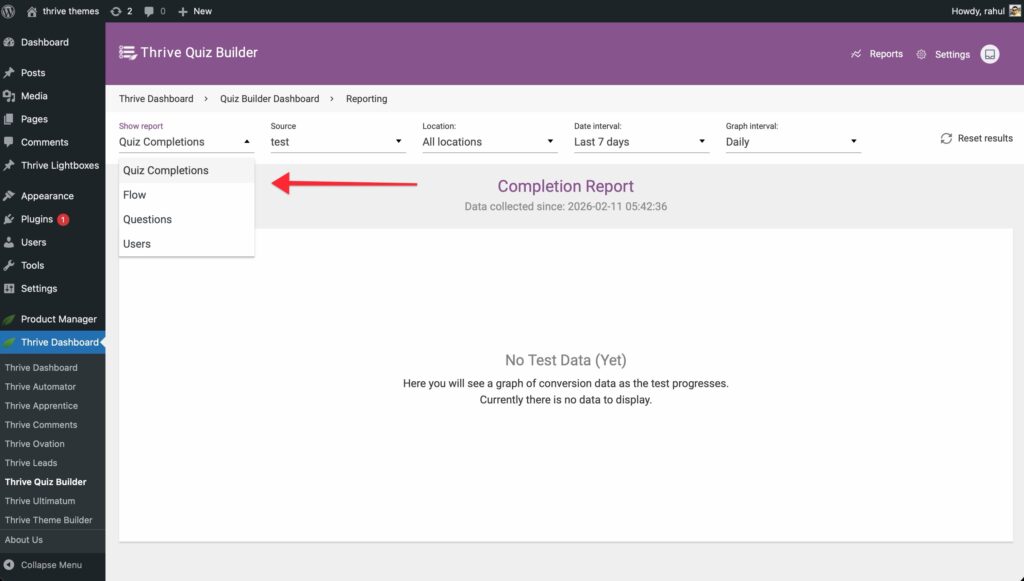
1. Quiz Completions
This report shows the ratio of users who started your quiz versus those who finished it.
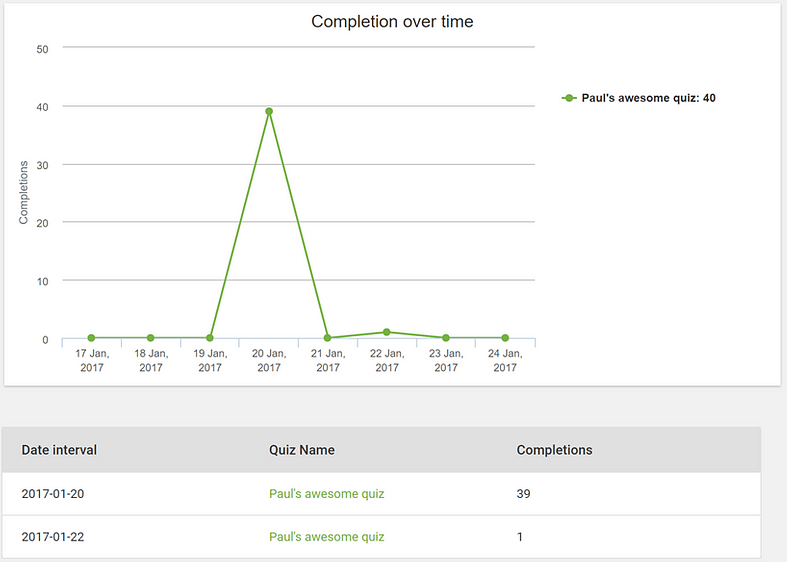
- Key Insight: If you see a high number of “Starts” but a low number of “Completions,” your quiz might be too long or a specific page (like the Opt-in Gate) might be causing users to leave.
2. Quiz Flow
The Flow report is a visual map that tracks the exact path users took through your quiz.
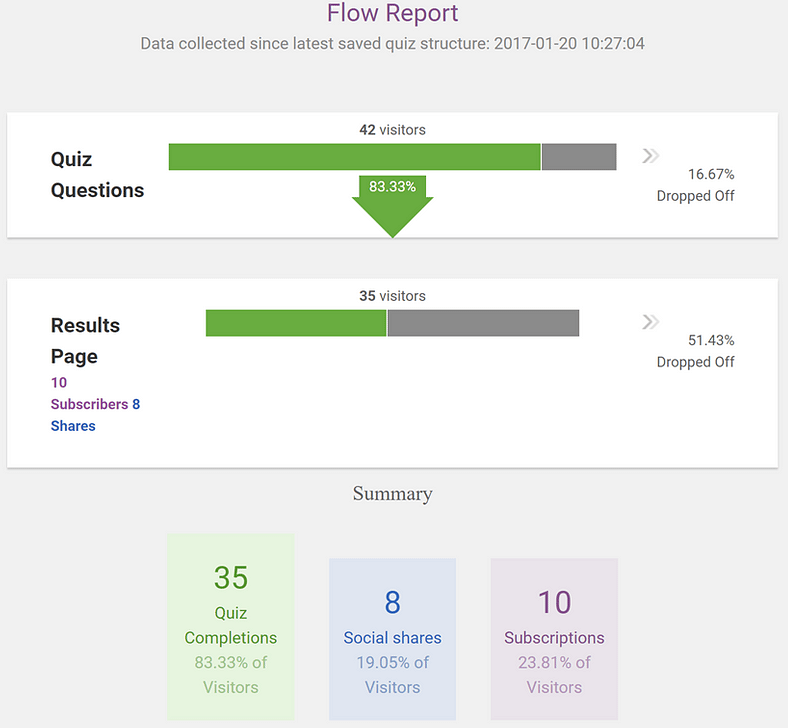
- Key Insight: Use this to identify where users are dropping off in the question sequence. If a specific question has a high exit rate, consider simplifying it or moving it later in the quiz.
3. Questions Report
This provides a detailed statistical breakdown for every question in your quiz.

- Key Insight: You can see which answers are the most popular. This is invaluable for market research and understanding your audience’s preferences.
4. Users Report
This is a granular list of individual quiz attempts.

- Key Insight: You can see exactly how each person answered every question and what their final result was. You can also export this data for further analysis.
Exporting Quiz Data
You can export your quiz response data as a CSV file for external analysis, record-keeping, or integration with other tools.

How to Export
- Open the Reports section for your quiz (as described above).
- Click the Export results button in the top-right area of the Reports page.
- The browser downloads a CSV file automatically.
The exported file is named quiz_{ID}_questionsAndAnswers.csv, where {ID} is your quiz’s internal identifier.
What’s Included in the Export
The CSV contains all question-and-answer data from your quiz:
- Columns — One column for each question in your quiz.
- Rows — Each row represents one user’s set of answers.
- Question types covered — Multiple choice answers, image-based answers, and open-ended (free text) responses are all included.
- Excluded data — Users who have been anonymized are not included in the export.
Note: The export focuses on quiz answers. User metadata such as names, email addresses, and completion dates is visible in the Users Report view within the dashboard but is not part of the CSV download.
Permissions
- The Export results button is only visible to administrators.
- The button appears on all four report types — Completions, Flow, Questions, and Users.
- Non-admin roles (Author, Editor, etc.) will not see the export button.
Tips
- The CSV uses UTF-8 encoding, so special characters and international text display correctly when opened in Excel or Google Sheets.
- For very large quizzes with thousands of responses, the export may take a few moments to generate.
- You can export from any report view — you don’t need to switch to a specific report type first.
Resetting a Quiz Builder Report
The Reset Results option allows you to reset all the conversion data you have collected from one of your quizzes. Basically, it resets all data from a quiz to zero.
This can be very useful if, for example, you gathered data before making your quiz public. Resetting the results will ensure you receive conversion data from your visitors without being interfered by the test data.
To reset results for a quiz, open the report in the particular quiz and click Reset results on the right.

Advanced Metrics
- Conversion Rates: The Reporting Suite automatically calculates the percentage of users who opted into your mailing list (Conversion Rate) and the percentage who shared the quiz on social media (Social Share Rate).
- Date Filtering: You can filter all reports by specific date ranges to see how seasonal promotions or site changes affect your quiz performance.
Related Resources
- A/B Testing: A/B Testing Your Quiz Pages for Higher Conversions
- Managing Quizzes: Managing Your Quizzes ( Dashboard & Import/Export)
- Thrive Quiz Builder Documentation: Explore the full Thrive Quiz Builder knowledge base