You’ve used PageSpeed Insights and tested your website to check your speed performance, and you’ve got to the point where Google gives you some metrics.
How do you interpret them and how much does the score provided by google really matter in your analysis?
Hopefully, this article will clear some things out for you.
Before you continue reading it, you might want to check these ones out first:
General notes regarding a ‘fast’ website
→ When talking about site speed performance, the most common approach is that a fast website is one that passes all core web vitals in the Field Data reported.
→ Google only takes into account Field Data for a ranking boost, so it’s important that when we perform an analysis, we interpret the data correctly.
The performance score (the red/yellow/green number) is based on Lab Data, so you might observe differences between the score and Field Data.
→ A low site performance score does not mean that your website will not get found by users in the Google Search. If your core web vitals result is better, Google will reward you with a ranking boost.
Please keep in mind that Core Web Vitals are just one out of many ranking signals that Google takes into account
→ The speed of your website depends on numerous factors, such as:
- Your hosting provider;
- Images used throughout your site;
- Videos used throughout your site;
- Your WordPress setup;
- Assets loading;
- Fonts;
- Icons;
You will find our recommendations for all of these in a table in this article, here.
Having all of these ideas in mind, please remember that as a website owner, finding the right balance between ultimate performance and complex functionality can be challenging.
Our job is to try and offer you as many suggestions as we can, and advise you what can be done in order to improve your Core Web Vitals.
Our suggestions and take regarding site speed
How does Thrive Themes optimize for Core Web Vitals?
Core Web Vitals optimization is an ongoing piece of work. Google has made it quite clear that site speed optimization is something that they’ll continually work on over the coming months and years by introducing new metrics and initiatives to make the web faster.
We are fully committed to staying up-to-date with the changes that are coming, and for this reason, we’ve built our asset optimization tool. In short, this means that our optimization algorithm can continue to evolve in line with Google’s official recommendations.
Suggestions for core web vitals optimization:
Images
|
Videos
|
WordPress Setup
|
JavaScript and CSS Files
|
Fonts
|
Layout ShiftsA bit lower in this article, we have explained what layout shifts are and what Google measures via them. The fewer such layout shifts you have throughout your site, the better your score will get.
|
Interpreting the score and metrics
When testing your site speed with PageSpeed Insights, you will get some results that look something like this:
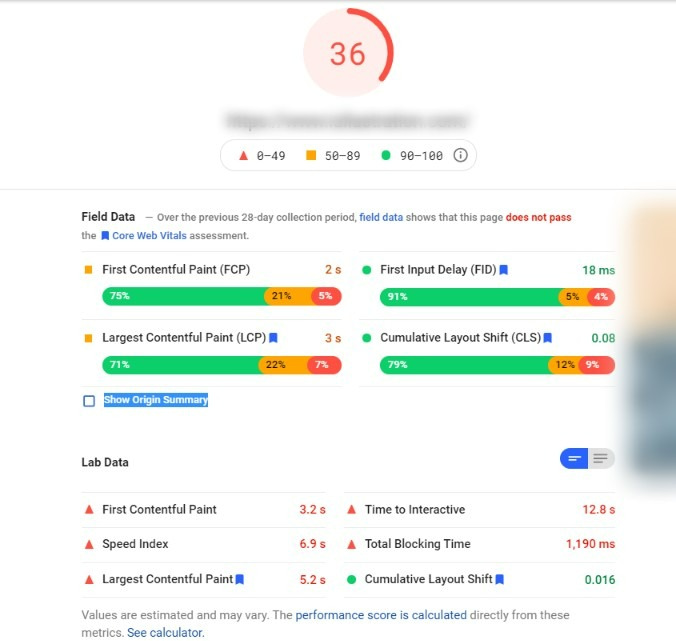
You will have a big red/yellow/green score on top of the screen, as well as some Field Data and Lab Data metrics.
We have explained these terms here, so please take a look if you need information about what each type of data represents:
You will also have these other Opportunities and Diagnostics metrics shown:
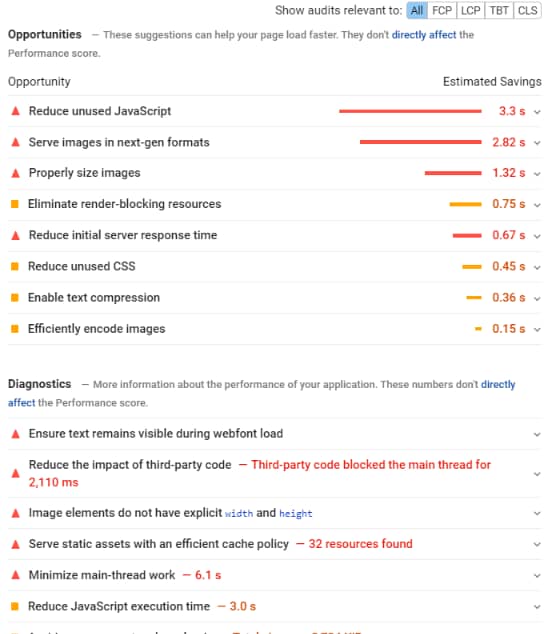
Here is, briefly, what this data means:
→ Field Data
As we’ve explained in our other article, Field Data is the data collected by Google from their Google Chrome Browser, and only from users that have agreed to share such data. This means it is real-world data, reporting metrics back to Google that your site visitors have actually experienced.
Under the Field Data section, you’ll see these metrics:
- First Contentful Paint (FCP)
According to web.dev, this measures the time from when the page starts loading to when a part of the web page is rendered on the screen.
- Largest Contentful Paint (LCP)
While the First Contentful Paint metric measures the amount of time until any part of the page starts loading, the Largest Contentful Paint metric measures the amount of time until the page’s main contents have finished loading.
- First Input Delay (FID)
First Input Delay is used to measure load responsiveness, as it represents the first impression users have of how fast your website loads.
FID measures the time from when a user first interacts with a page (opens a link/ clicks on a button/ etc.) to the time when the browser starts processing the event and responds to that interaction.
- Cumulative Layout Shift (CLS)
Cumulative Layout Shift is used to measure layout shift scores for every unexpected layout shift that occurs during the entire lifespan of a page.
A layout shift represents the moment when a visible element changes its position on the web page, from one rendered frame to the next.
→ Lab Data
Lab Data represents a simulation of what your website’s user experience would be for a particular user, the specific device they use, and the quality of their internet connection. Unlike Field Data, Lab Data is immediately available. You can test your site, make a change, and test again to see what difference it makes – no need to wait 28 days.
Under the Lab Data section of your analysis, you will see some of the data shown under the Field Data section, such as FCP and LCP, as well as the CLS. Besides those, which we’ve explained above, you will also get these metrics:
- Speed Index
Speed Index will determine how quickly the contents of a page are visibly populated. The metric represents the average time at which visible parts of the page are displayed.
- Time to Interactive
The Time to Interactive metric represents the time it takes for a page to become fully interactive.
- Total Blocking Time
Total Blocking Time is the amount of time that passes between the First Contentful Paint (when the first part of the web page is rendered) and the Time to Interactive (when the page fully loads and becomes fully interactive).
→ Opportunities
The next section is the “Opportunities” one, where Google will give you some suggestions on what you can do to improve your score. Clicking on each opportunity will open more information about it:
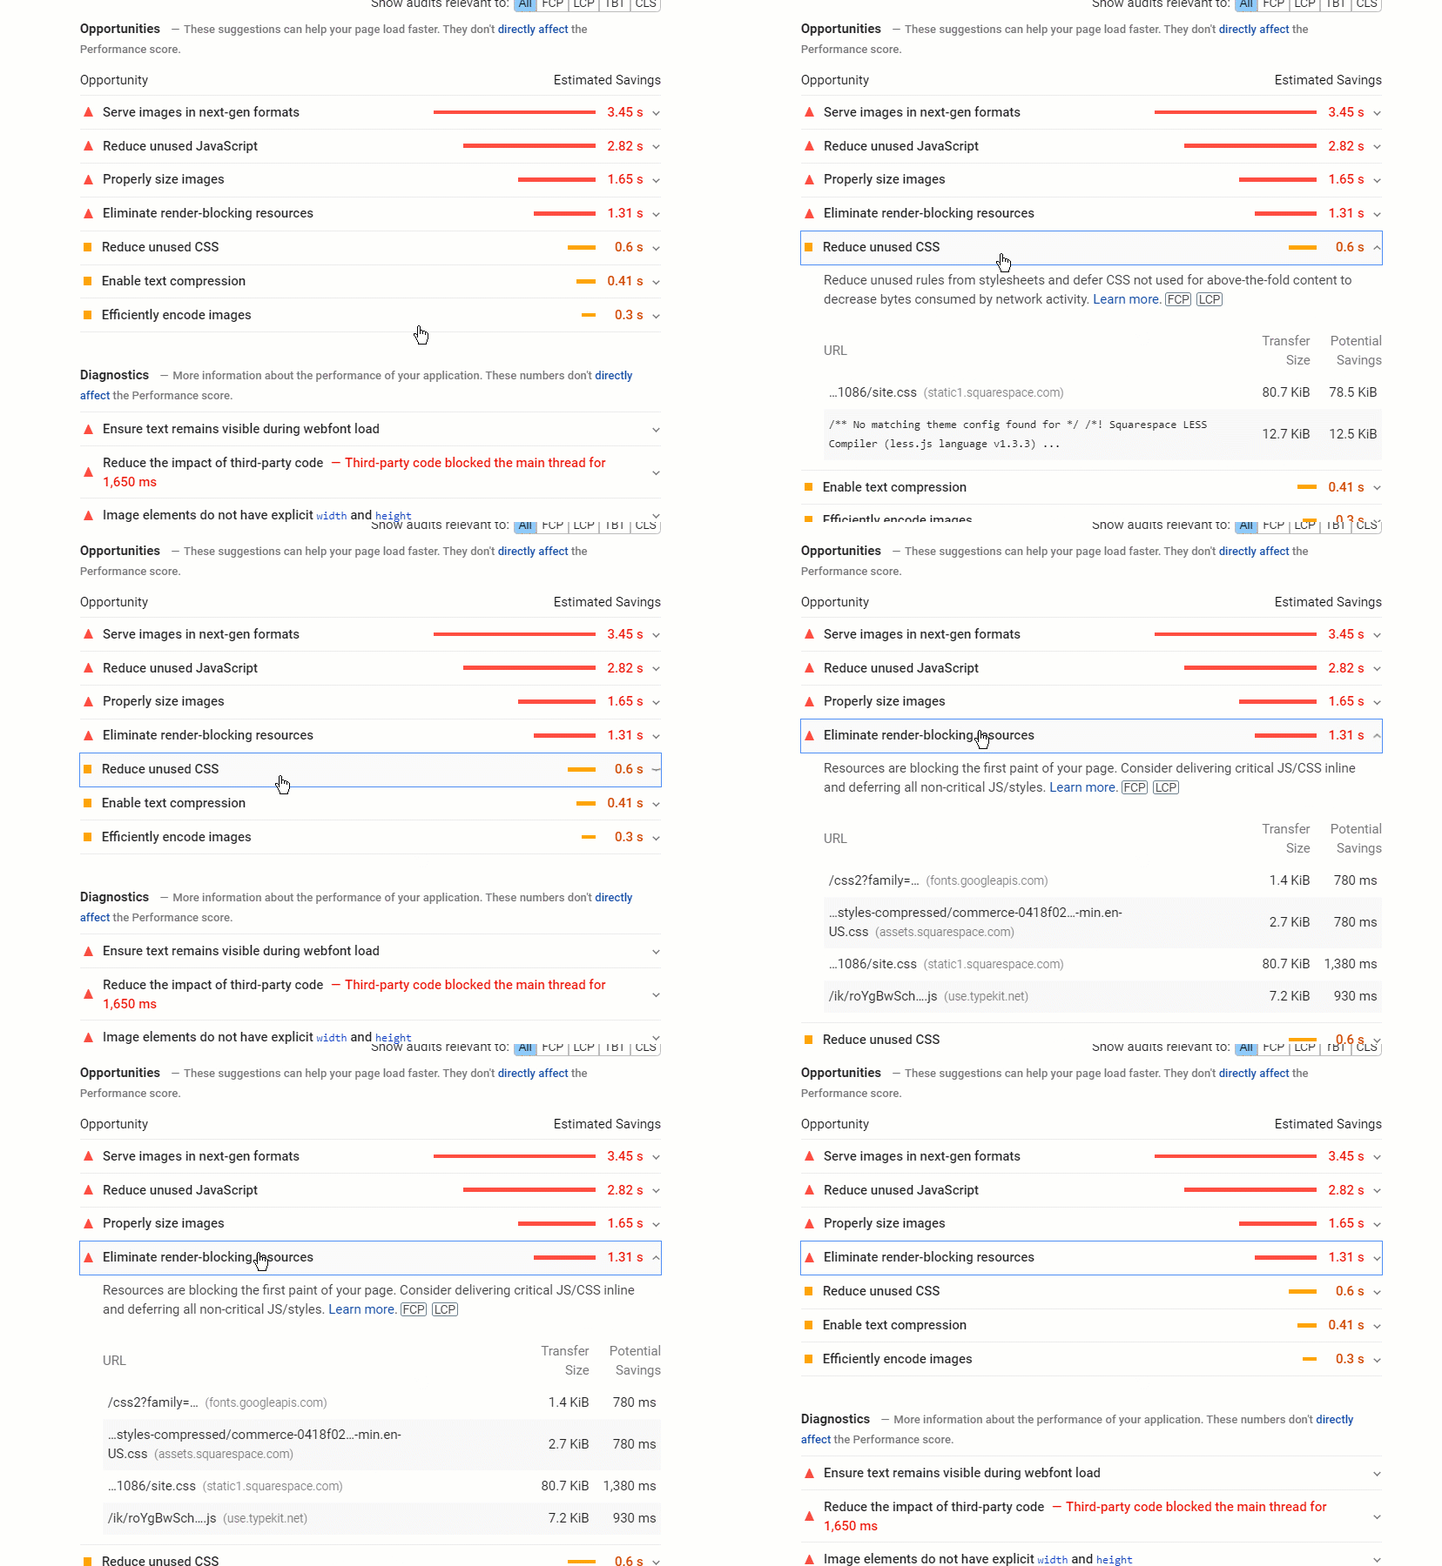
To be noted here is that:
- If you are not using an image optimization tool, you will get some suggestions related to the images used on your site, such as trying different image formats, re-sizing them, etc.
- If you have not activated Project Lightspeed, you will be suggested to reduce unused JavaScript and CSS files; enabling our asset optimization tool will do just that.
→ Diagnostics
The diagnostics represent additional information about the performance. Here, too, you can click on each item, to receive detailed information about it:
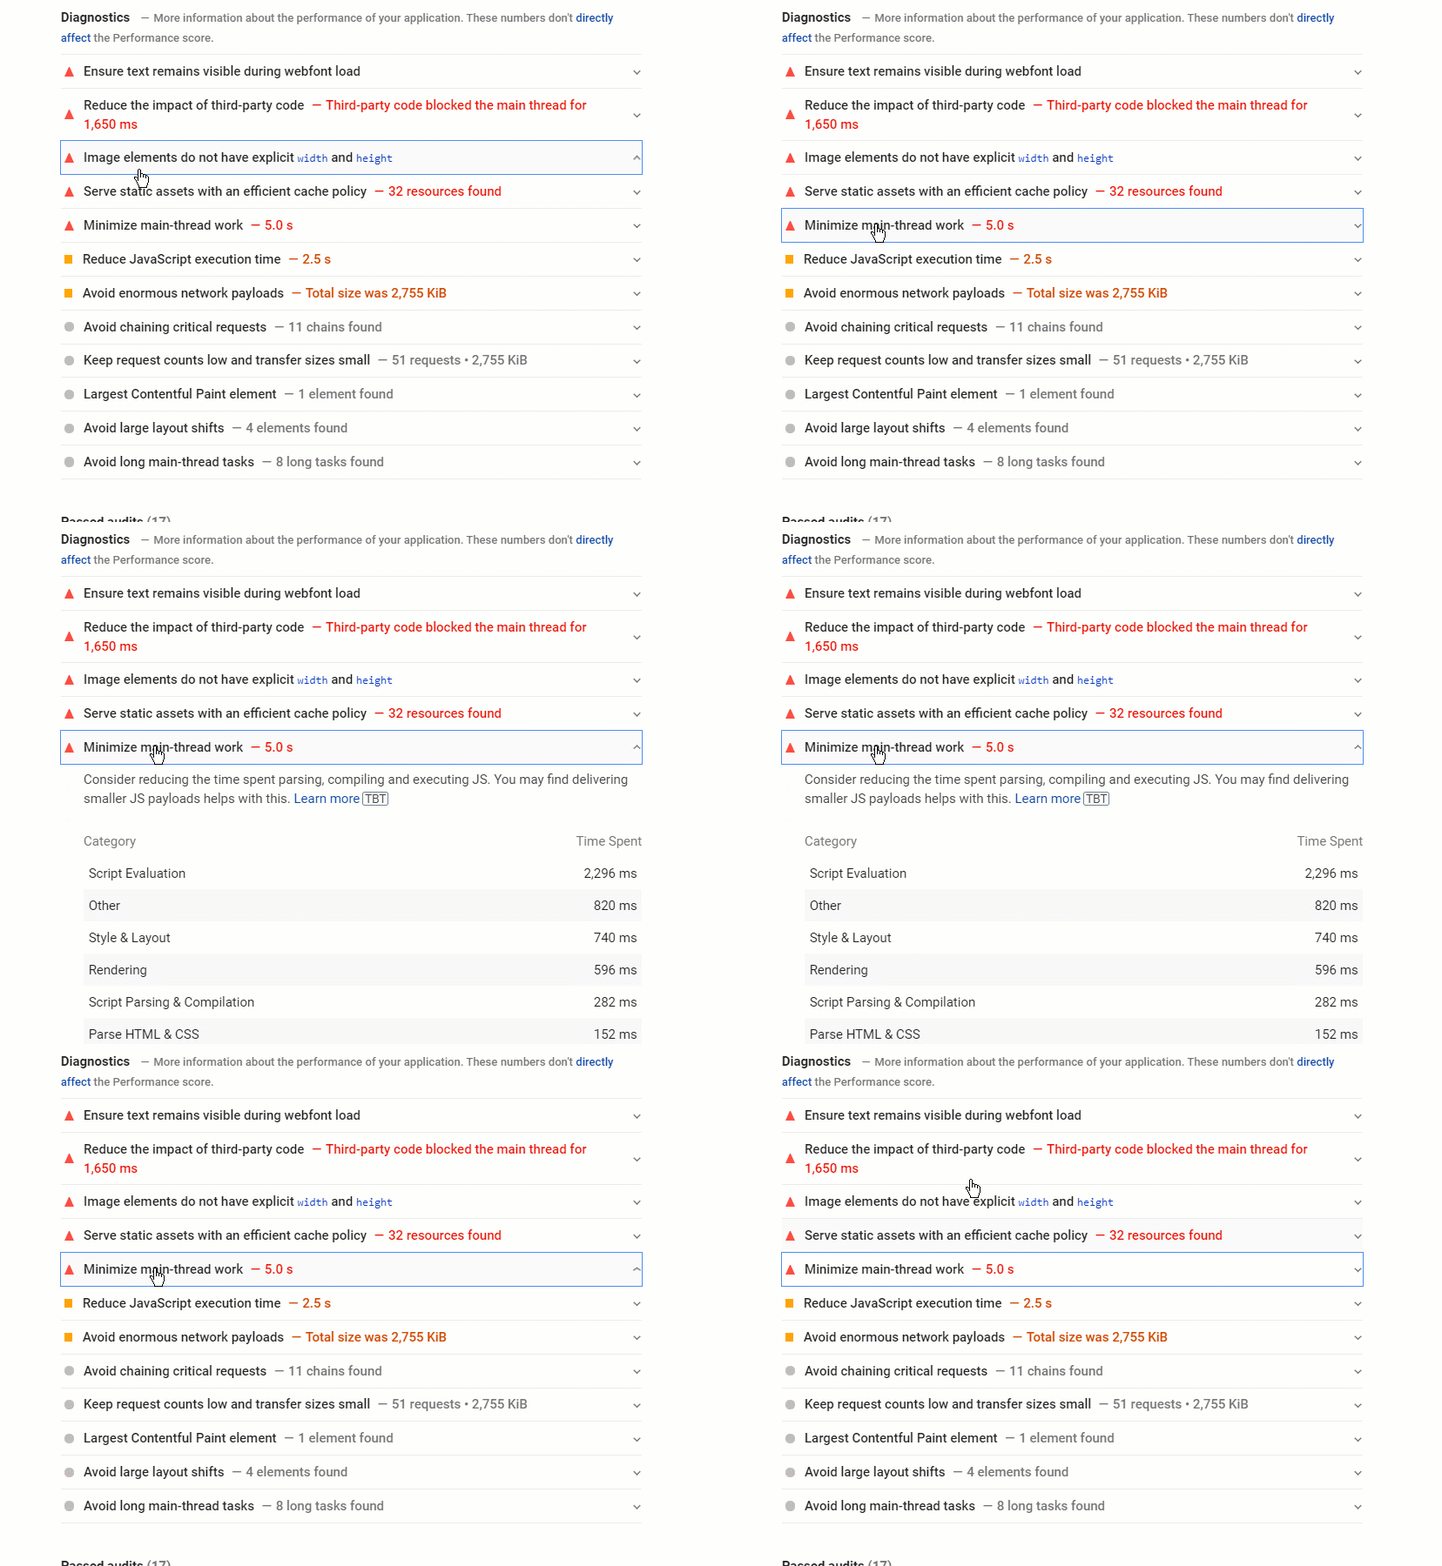
Once you run the analysis on your site, you can go ahead and check each metric, and see what you can improve, on both the desktop and the mobile versions of your site.
We cannot stress enough that Thrive Themes can only do so much to help you with the site performance score. All of our recommendations are valuable and will help you increase the speed of your site, but there are other things to keep in mind, as well.
Hopefully, this article was useful to you. Don’t forget to check out the rest of the articles from our knowledge base.
