The Thrive Automator dashboard consists of several sections that help you understand how your automation works, what’s its status, and so on.
In this article, we will have a quick look at each section of the Thrive Automator dashboard, so keep on reading if you want to learn more about this topic.
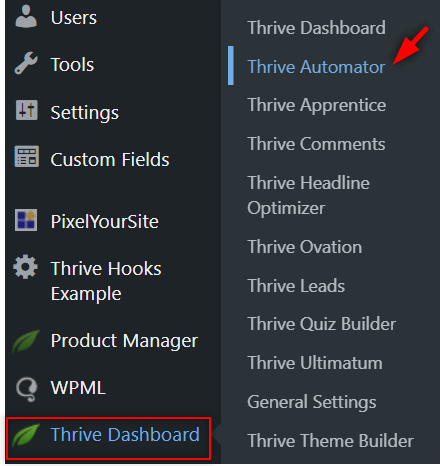
Thrive Automator can be easily accessed from your Thrive Dashboard:
As soon as you access it, you will be taken to this view where you can view all your active and inactive automations.
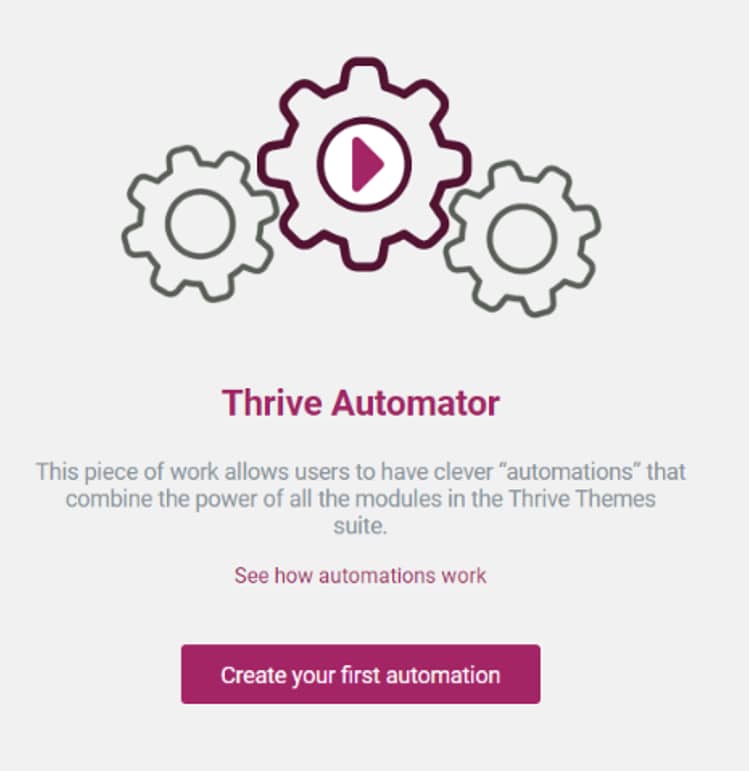
If this is the first time you are accessing it, then the dashboard will be empty. You will have the option of creating your first automation from here:
Right off the bat, the left sidebar might be very familiar to you if you are already using Thrive Theme Builder or Thrive Apprentice on your website:
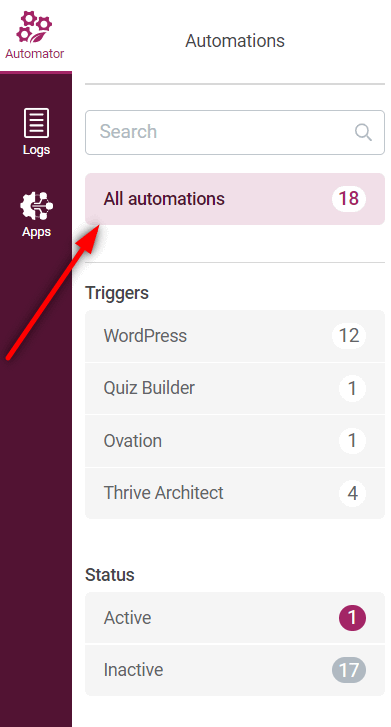
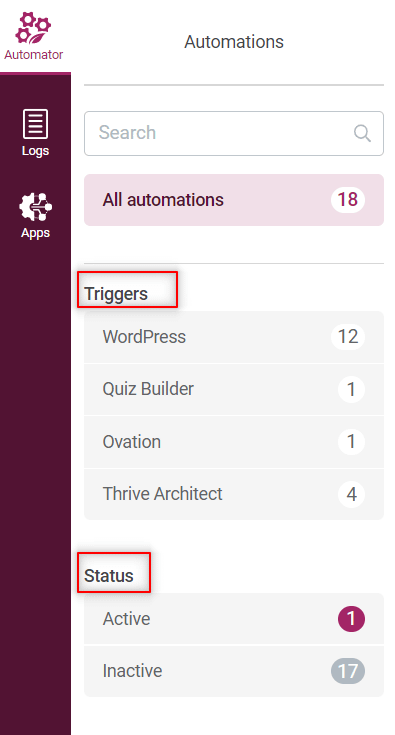
The left sidebar is basically a list of all your automations, split by “Triggers” and “Status”:
You also have a search bar that you can use to type in the name of the automation you are looking for.
Next, under the “Triggers” section, you will be able to view all the automations you have created based on the triggers you set for each of them:
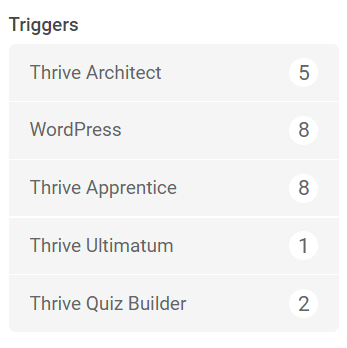
This article explains more in-depth what kind of triggers you can use when setting up your automation.
Next, you can also filter your automations by their “Status”:
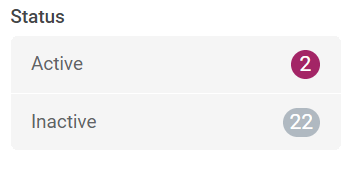
Moving forward, the main part of the dashboard consists of the actual list of automations:
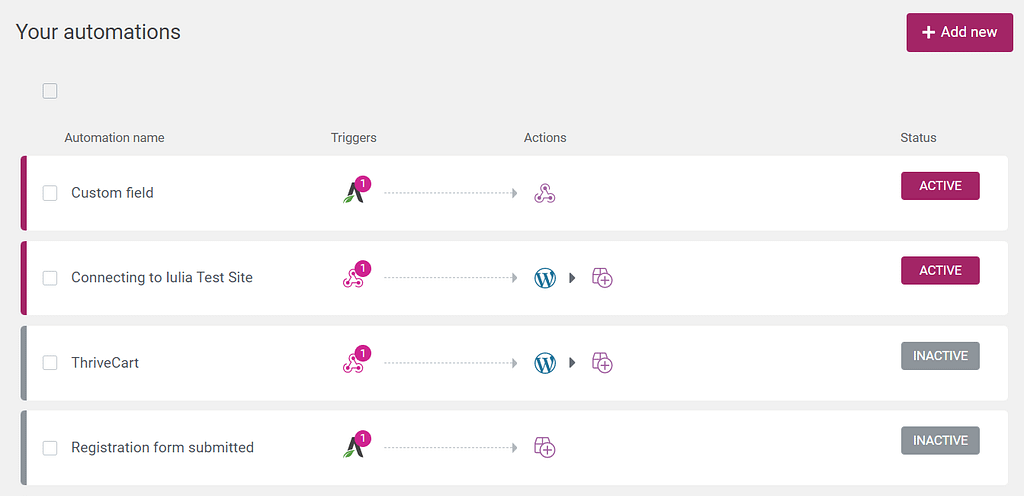
You can view here all the automations that you have created so far (both published and unpublished), and create new ones if you want.
These articles from our knowledge base might be useful to you if you want to learn more about creating and editing an automation:
Hopefully, this quick guide about how to use the Thrive Automator dashboard was useful to you. Don’t hesitate to check out other tutorials of this type available in our knowledge base!