The results page is the climax of your quiz. In this article, you’ll learn how to customize the layout, display dynamic results based on user scores, and add a “Retake the Quiz” option.
Accessing the Results Page Editor
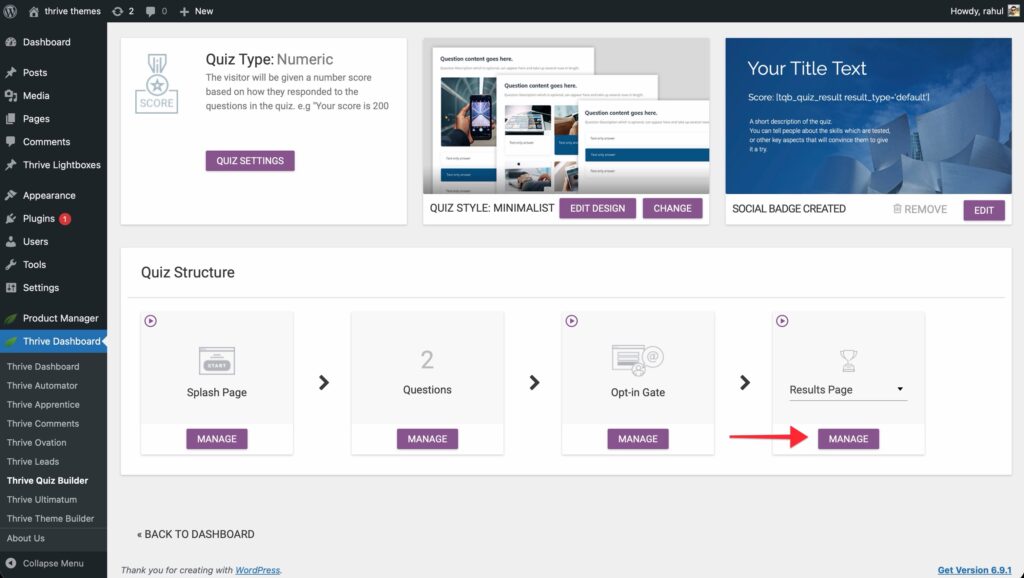
- Navigate to the Thrive Quiz Builder dashboard.
- Find the Results Page card in the Quiz Structure section.
- Click Manage.
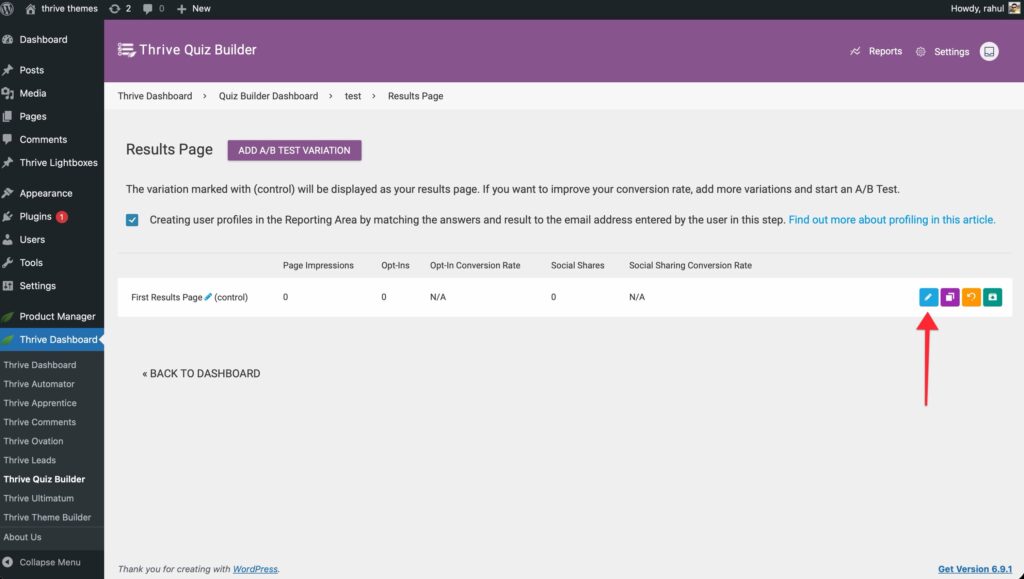
- Click the Edit with Thrive Architect button.
Dynamic Results & Content
You can make the results page change automatically based on how the user answered.
1. Displaying the Quiz Score
To show the user their specific result:
- Add a Text element to your page.
- Highlight the text and click the Dynamic Text icon (blue person) in the toolbar.
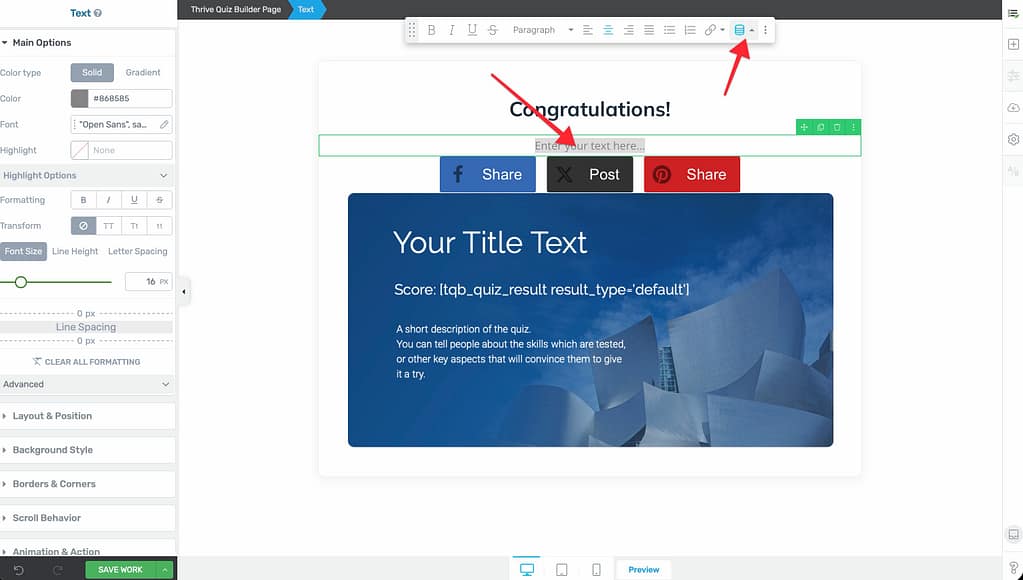
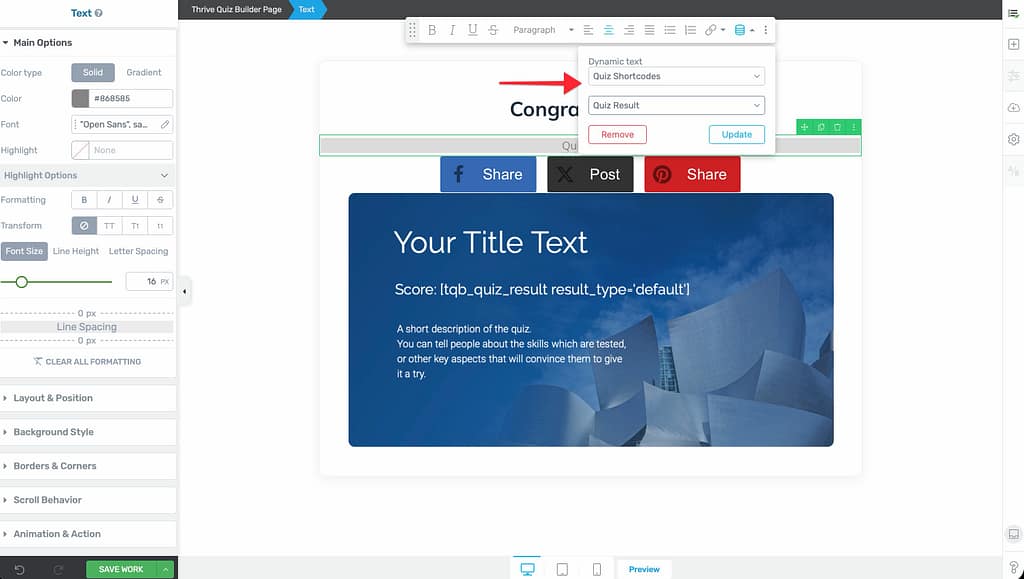
- Select Quiz Shortcode > Quiz Result.
2. Displaying Category Data
If your quiz uses categories, you can go beyond showing just the winning category name. The Category Data feature lets you display individual category scores or a full ranked list of all categories on your results page.
Note: The Category Data option only appears if your quiz has categories defined. For number, percentage, and right/wrong quizzes, the shortcode modal stays the same as described above.
To access the category breakdown options:
- Add a Text element to your results page.
- Highlight the text and click the Dynamic Text icon in the toolbar.
- Select Quiz Shortcodes > Quiz Result.
- Under What to display, you’ll see two tabs: Winner (selected by default) and Category Data.
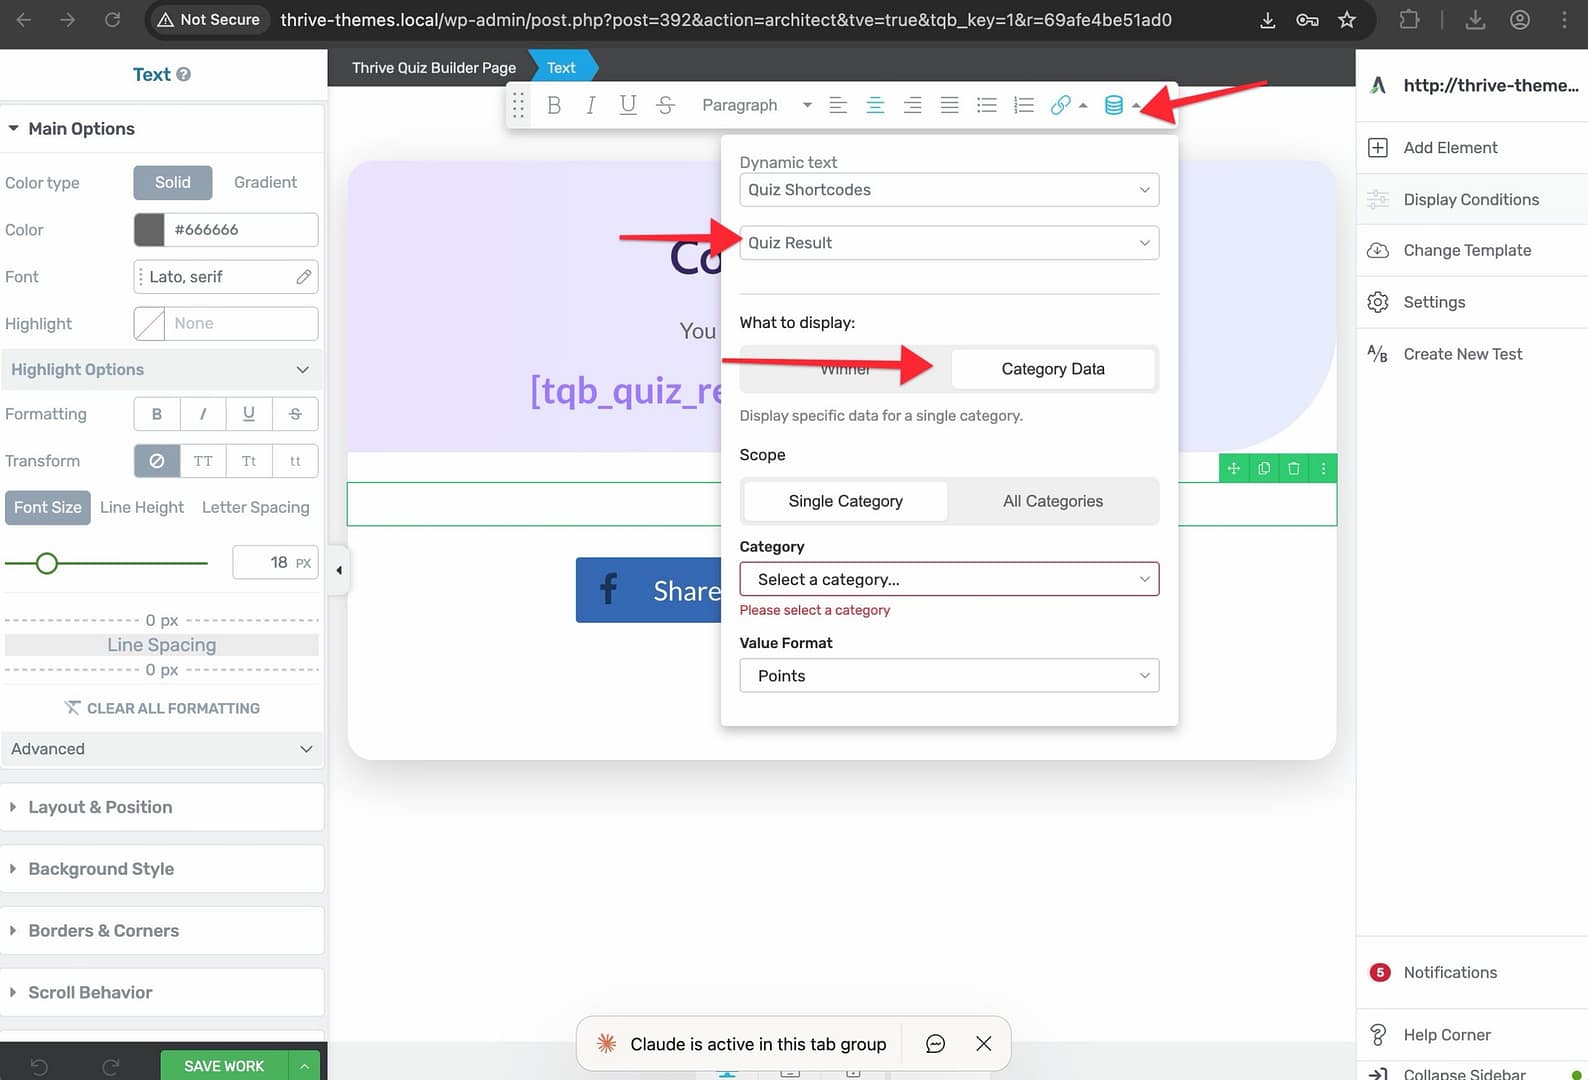
- Click Category Data to reveal the category options.
Option A: Single Category
This displays the score for one specific category. Use this when you want to show separate results for each category in different areas of the page.
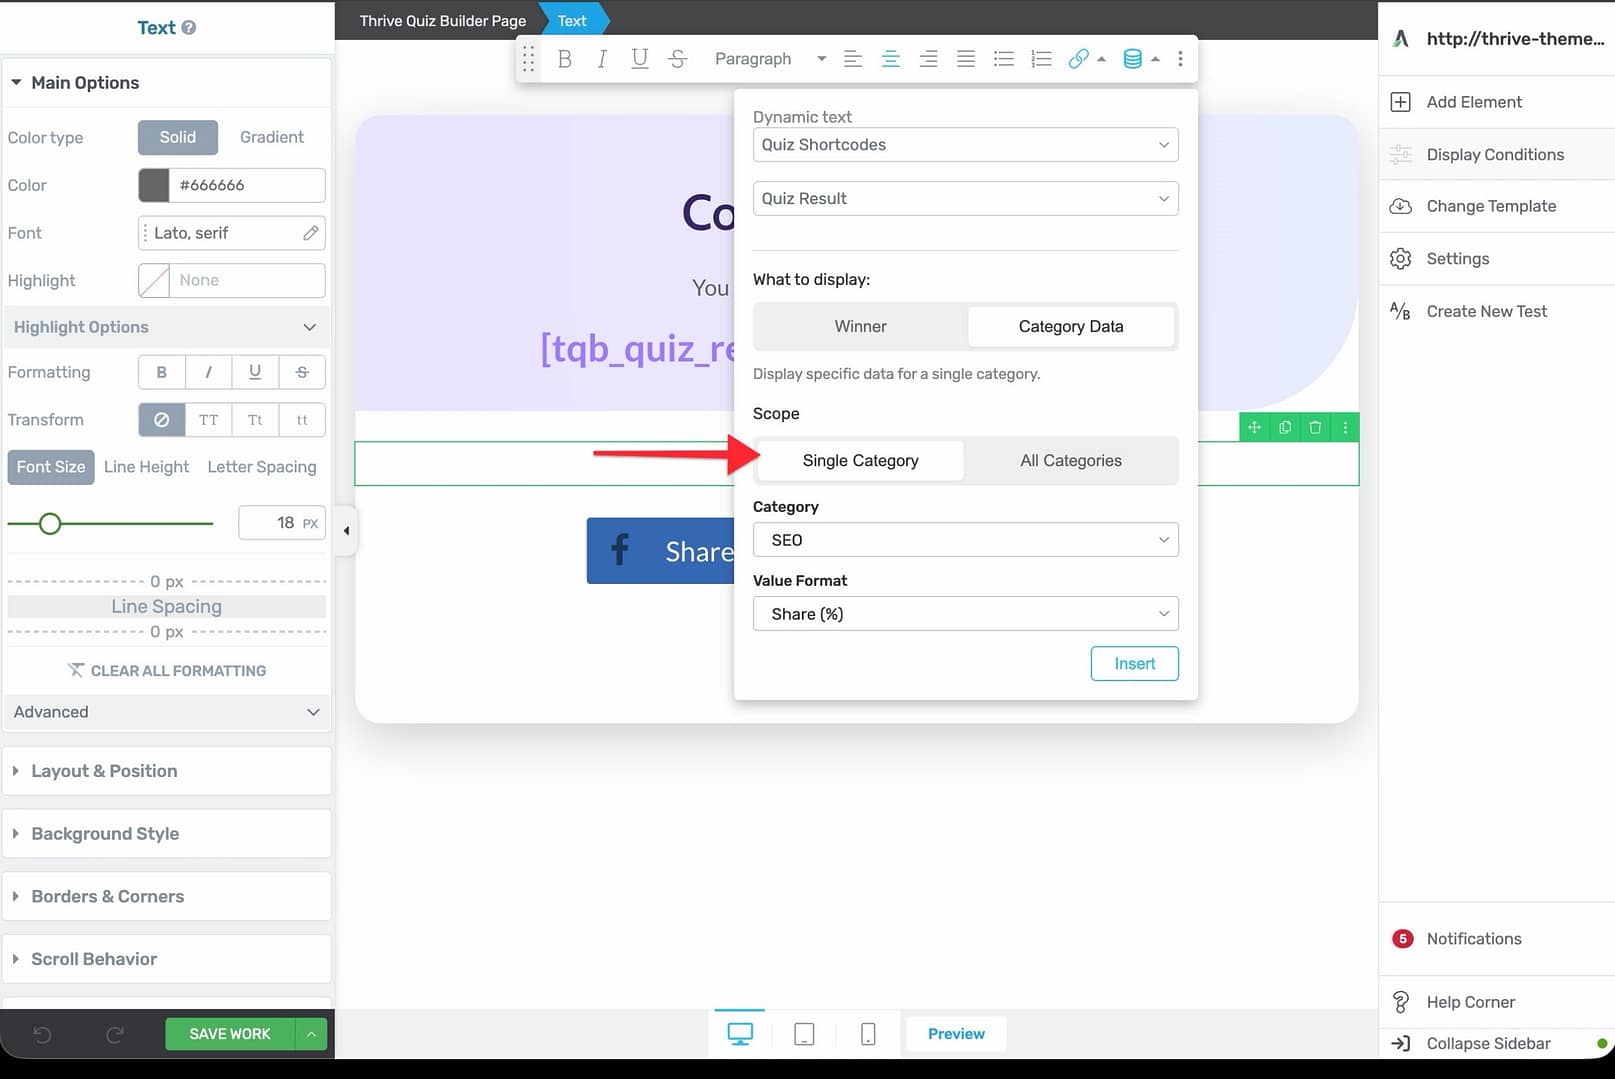
- Under Scope, select Single Category (active by default).
- Choose a category from the Category dropdown.
- Choose a format from the Value Format dropdown:
Points — The raw point value earned in that category.
Share (%) — This category’s points as a percentage of total points across all categories.
Percent of max (%) — This category’s points as a percentage of the maximum possible points for that category. - Click Insert.
The shortcode output looks like this: 0
Note: The Insert button remains disabled until you select a category from the dropdown.
Option B: All Categories
This displays a ranked list of every category and its score. Use this when you want to give users a complete overview of their performance across all areas.
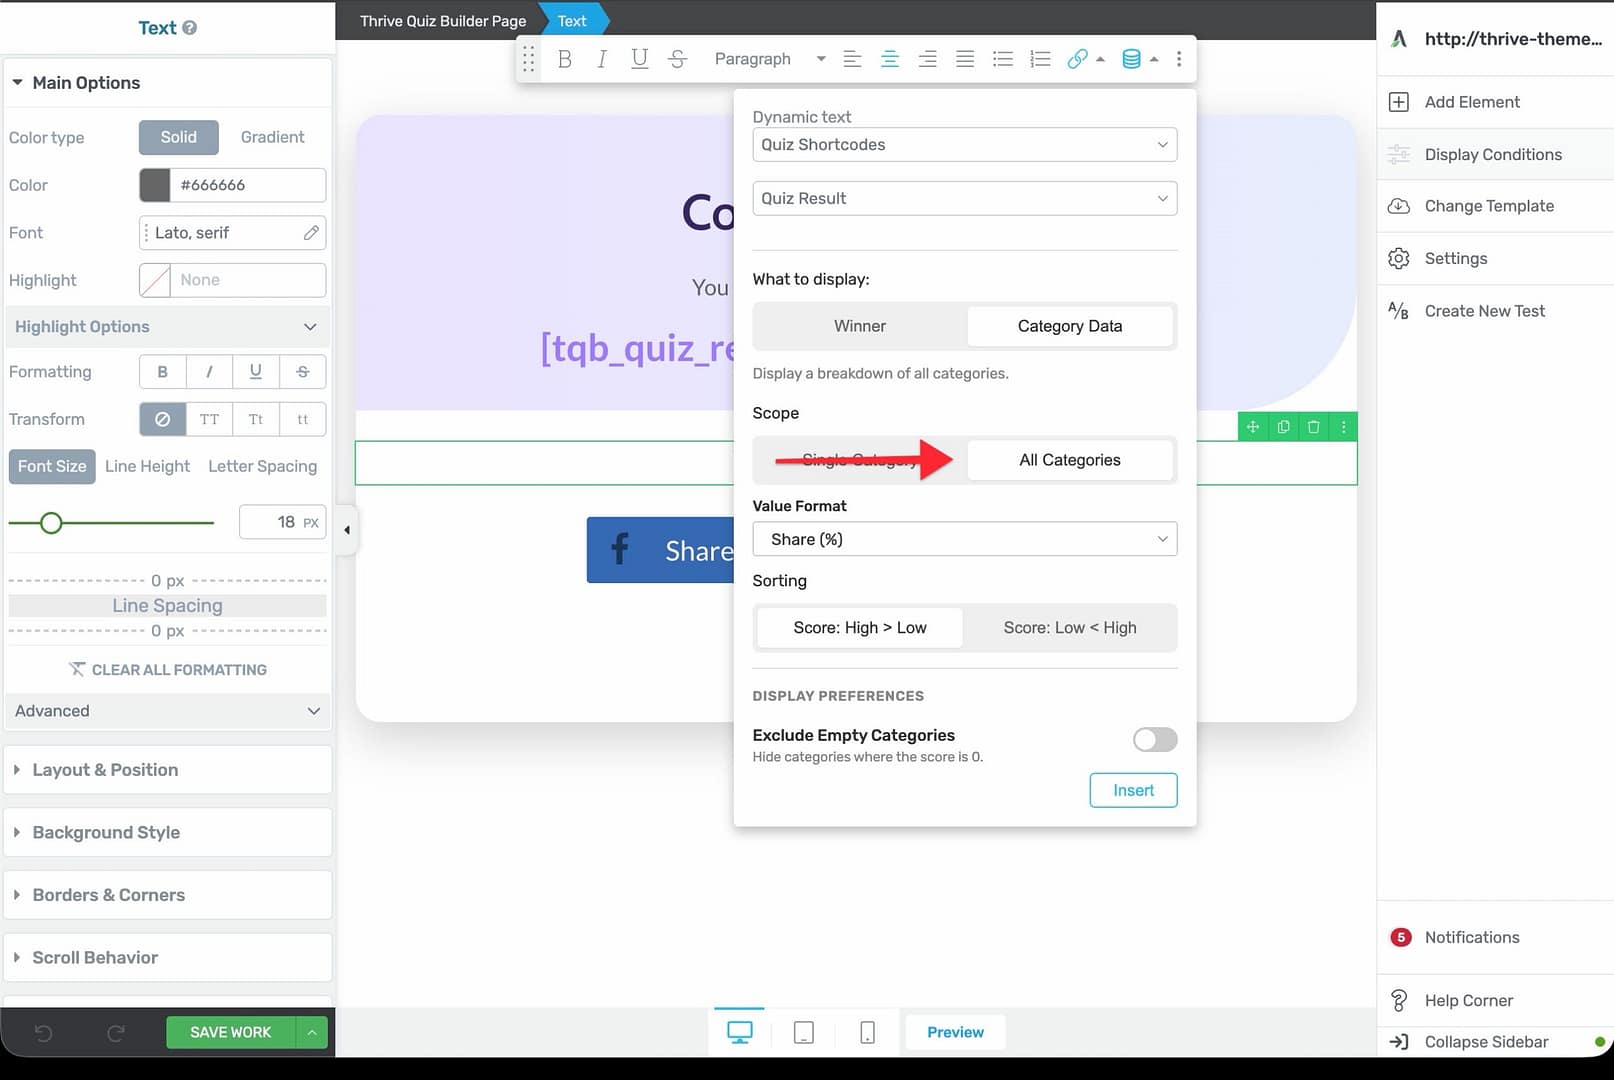
- Under Scope, select All Categories.
- Choose a format from the Value Format dropdown:
Points — Raw point values.
Share (%) — Each category’s share of total points.
Percent of max (%) — Each category’s percentage of its own maximum. - Under Sorting, choose how results are ordered:
Score: High > Low (default) — Categories with the most points appear at the top.
Score: Low < High — Categories with the fewest points appear at the top. - Under Display Preferences, optionally enable the Exclude Empty Categories toggle to hide categories where the user scored zero points.
- Click Insert.
The shortcode output looks like this: 0
With the Exclude Empty Categories toggle enabled: 0
Shortcode Parameter Reference
Here is a quick reference for all available shortcode parameters:
- Winner (default) — No extra parameters needed.
- Scope: Single Category —
category='<category name>' - Scope: All Categories —
show_all_categories='true' - Value Format: Points —
result_type='points' - Value Format: Share (%) —
result_type='share' - Value Format: Percent of max (%) —
result_type='percent' - Score: High > Low —
sort_by='highest' - Score: Low < High —
sort_by='lowest' - Exclude Empty Categories —
exclude_empty='true'
Things to Know
- Switching from Category Data back to Winner hides the tabbed interface and resets all selections to their defaults.
- Switching between the Single Category and All Categories tabs resets that tab’s controls to defaults.
- You can place multiple shortcodes on the same results page — for example, one
0for the winning category name plus several single-category shortcodes for a detailed breakdown below.
3. Formatting Decimals
For percentage-based quizzes, you can show a more precise score:
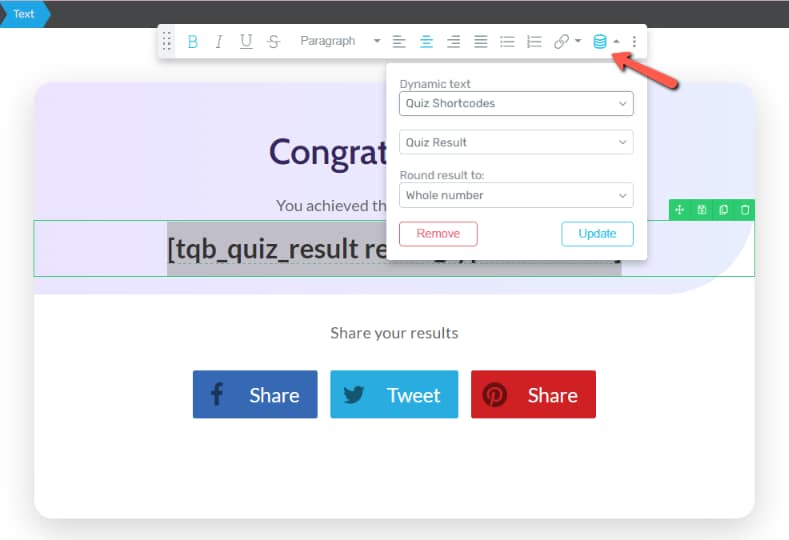
- In the Dynamic Text sidebar, look for the Formatting section.
- Enable the Display decimals toggle and set the number of decimal places (e.g., 1 or 2).
4. Using Dynamic Content Blocks
Want to show an entirely different layout for users who failed vs. those who passed?
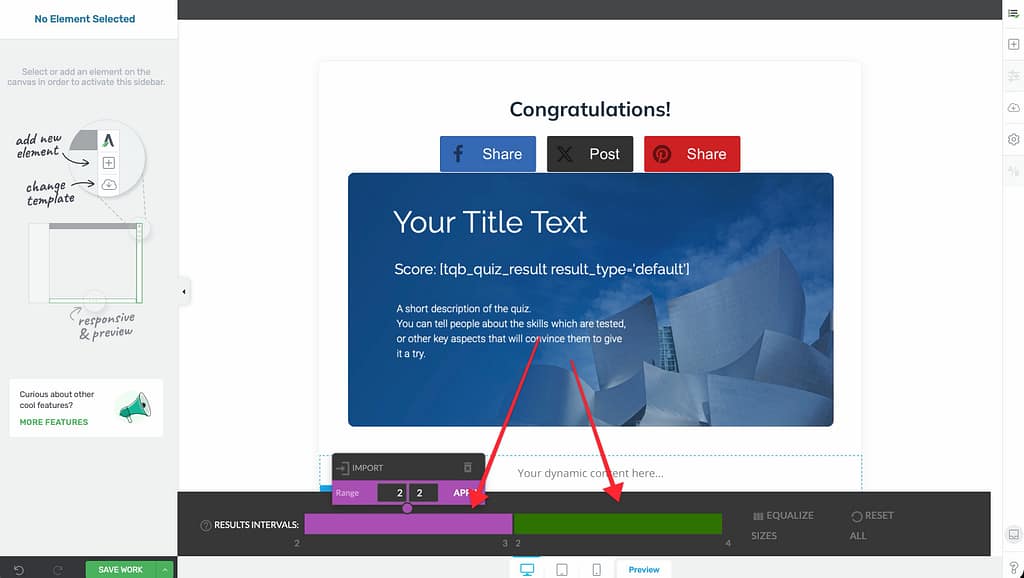
- Add the Dynamic Content element to the Results Page.
- Create States for different score intervals (e.g., 0-50, 51-100) or categories.
- Design each state with unique images, text, and call-to-action buttons.
Adding a “Retake the Quiz” Button
Allowing users to try again can improve engagement.
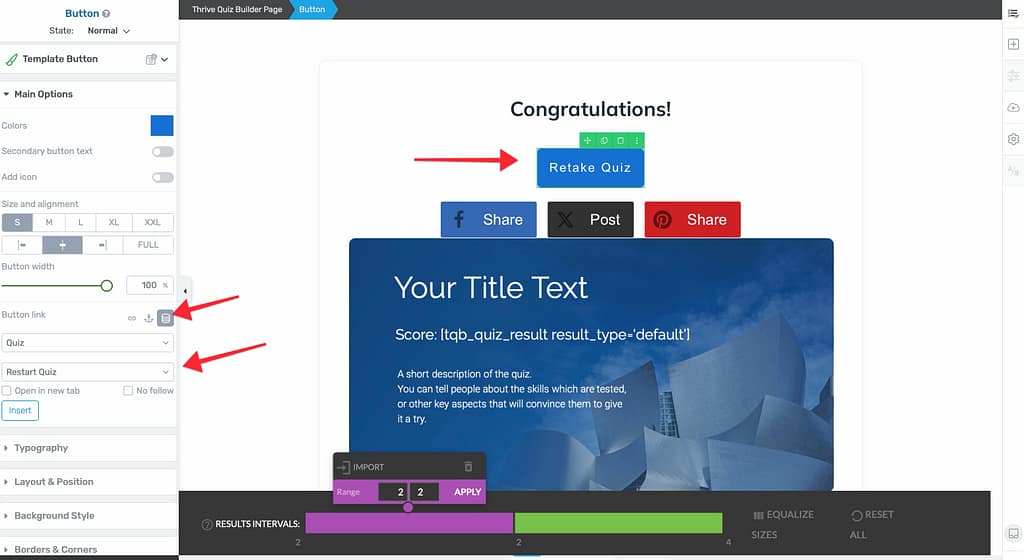
- Add a Button or Text element to the Results Page.
- In the toolbar, click the Dynamic Link icon.
- Choose Thrive Quiz Builder > Retake Quiz.
- Click Apply.
Related Resources
- Redirects: Configuring Quiz Redirect Settings
- Opt-in Gates: Using the Opt-in Gate in Thrive Quiz Builder
- Navigation: Quiz Navigation, Progress Bars & Flow Control
- Thrive Quiz Builder Documentation: Explore the full Thrive Quiz Builder knowledge base