In this article, you’ll learn how to check your conversion results and analyze your performance using the A/B Test Overview and Test Details dashboards. This guide will walk you through reading your reporting charts, understanding key metrics, and choosing a final winner for your test.
Accessing the A/B Test Overview
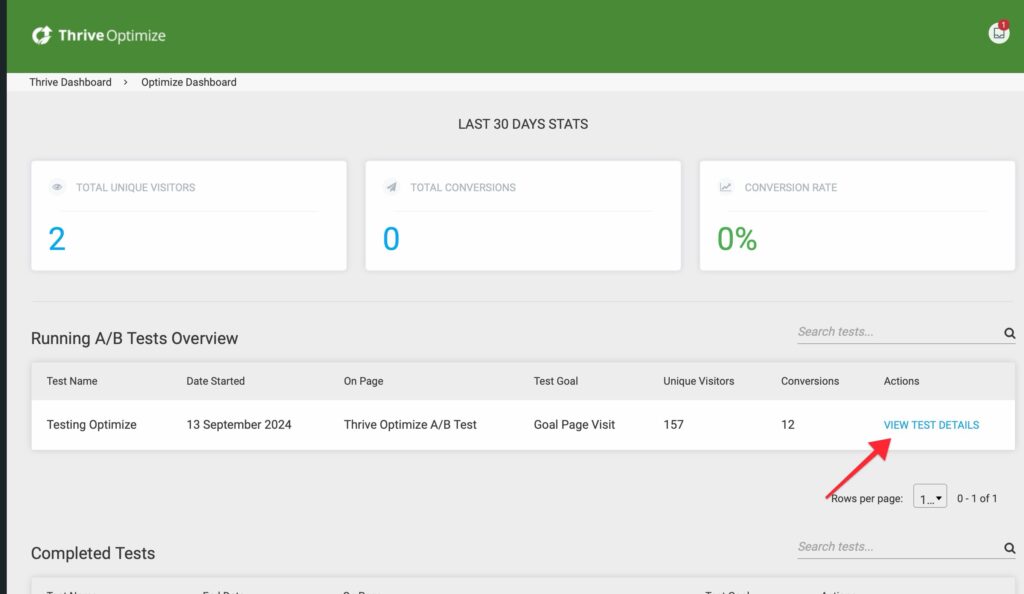
Once your A/B test is running, you can access the results dashboard:
From the WordPress Dashboard: Open the Thrive Dashboard > Thrive Optimize page in the WordPress Dashboard and click the View Test Details button.
Analyzing Your A/B Test Charts
The test overview includes a chart that tracks your conversions over time. You can customize how this data is displayed to get a clearer picture of your performance.
Choosing Your Graph Type
You can toggle between two graph types to see your results from different perspectives:
- Conversion Rate: Displays your results as a percentage, helping you see the efficiency of each variation.
- Conversions: Displays the raw number of conversions recorded for each page.
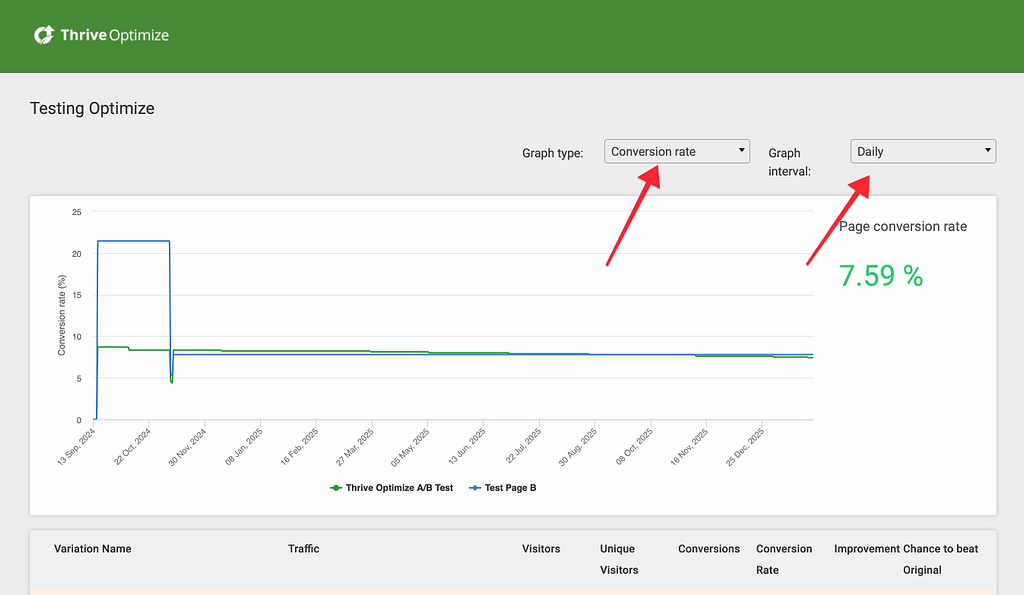
Setting the Graph Interval
You can also change the time scale of your graph to identify trends more easily. Choose between:
- Daily
- Weekly
- Monthly
Understanding the Detailed Test Report
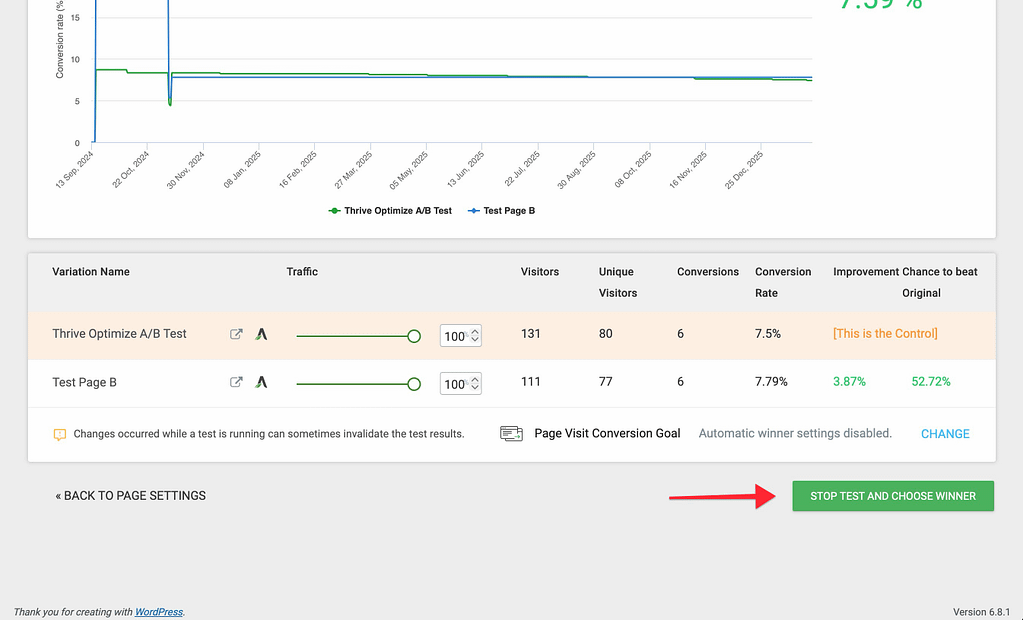
Below the charts, you’ll find a detailed table that breaks down the performance of each individual page in the test. Here is what each column represents:
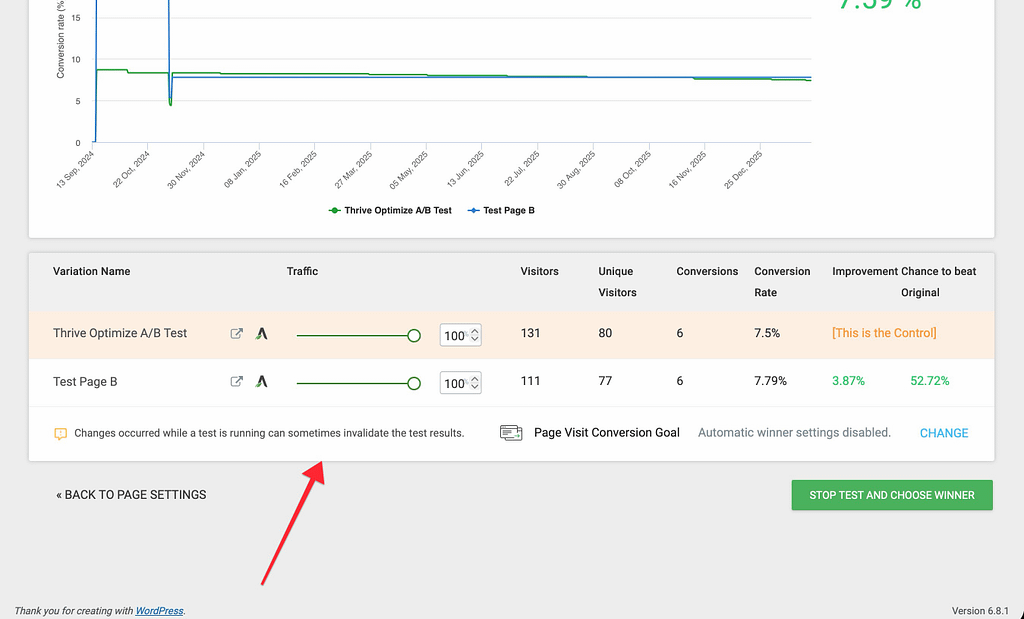
- Variation Name: The name you gave to each page version.
- Traffic: The percentage of visitors being sent to each page. You can still adjust these sliders while the test is active.
- Visitors: The total number of visitors that have accessed your page (including repeat visits).
- Unique Visitors: The number of individual people who have seen your page.
- Conversion: The total number of conversions recorded based on your chosen goal (e.g., opt-ins).
- Conversion Rate: The percentage of unique visitors who converted on that specific page.
- Improvement: Shows how each variation is performing compared to the original Control page.
- Chance to Beat Original: A calculated probability that a variation will ultimately outperform the Control page based on current data.
Choosing a Winner
You can end your A/B test at any time by choosing a winning variation.
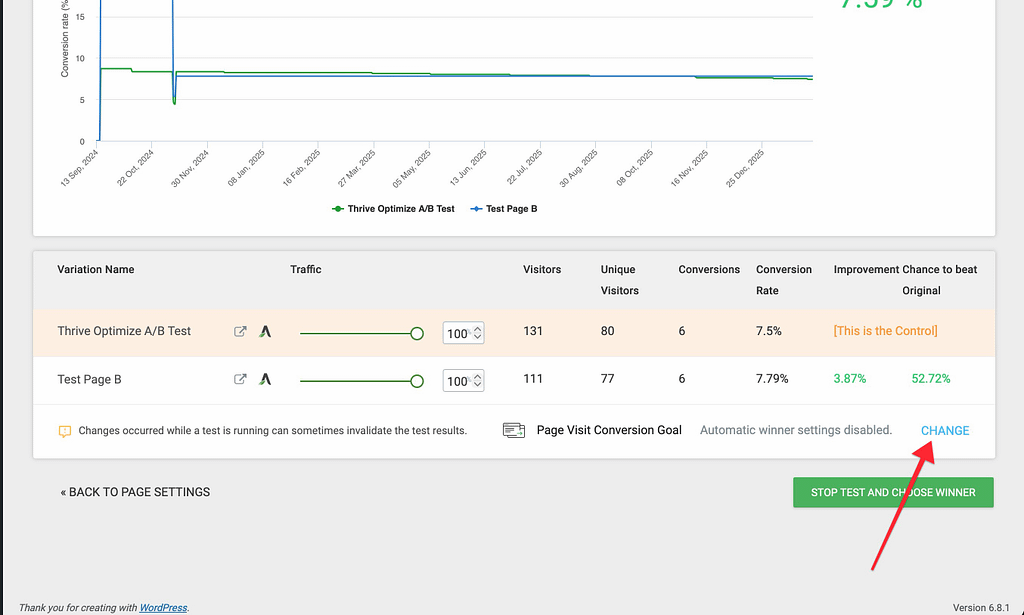
Automatic Winner Settings
If you want Thrive Optimize to pick a winner for you based on specific data, you can click the Change button in the Automatic Winner Settings area. This allows you to set parameters like minimum conversion numbers or test duration.
Manually Choosing a Winner
To end a test manually and select the version you want to keep:
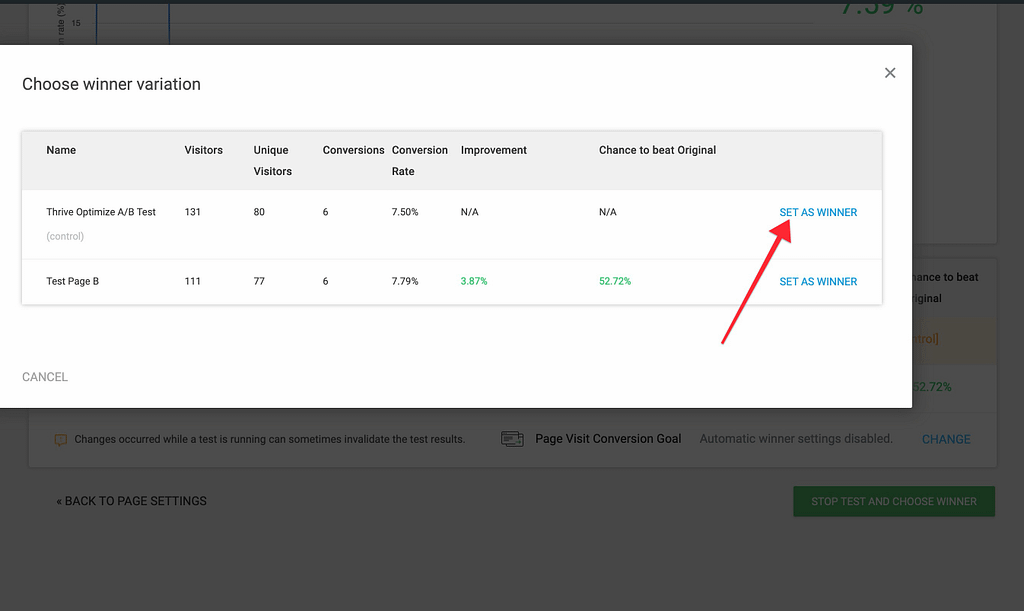
- Click the Stop Test and Choose Winner button.
- In the popup window, review the conversion reports for all variations.
- Click the Set As Winner button next to the version you want to move forward with.
Conclusion
That’s it! You’ve successfully learned how to use the A/B Test Overview and Test Details to monitor your performance. You now know how to read your reporting charts and select the best-performing version of your page.
If you’re still having trouble navigating your test results, check out the related articles below.
Related Articles
- Creating Tests: Follow our guide on how to create your first A/B test using Thrive Optimize.
- Goal Types: Learn more about A/B test goal types in Thrive Optimize.
- FAQ: Get answers to common questions in our Thrive Optimize FAQ.
Thrive Optimize Documentation: Explore the full Thrive Optimize knowledge base for more tutorials.